The Brief Rise and Rapid Fall of Alex Neil – What Happened?

So, there we have it. A 1-0 loss to bottom-of-the-table Sheffield Wednesday the final nail in Alex Neil’s 16 month tenure at Stoke City, and we’re in the market for a manager for the 5th time since relegation.

If you would like a reminder, please do go back and check out the xG article from last year.

After a shaky start, Neil looked to have turned things around with an incredible run of 12 games or so from February to April 2023. 21 points from a possible 36, including huge wins over Sunderland and Coventry, gave fans hope that things may finally be coming together.

The run was everything Neil had promised. Front-foot, aggressive football, intelligent high pressing, creativity and directness in attack, and most of all: fun. It was something we hadn’t seen since the COVID-hit end to the 19/20 season, and we didn’t even get to experience that in person.

Those beautiful days of blue shading are long gone. Data: Opta via FBref.com

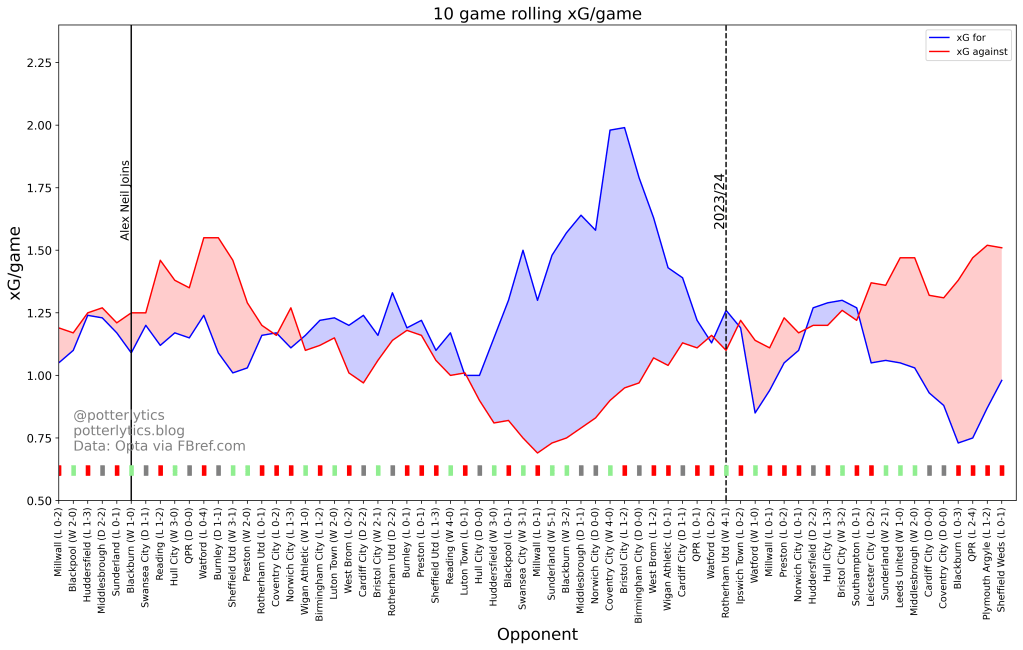
But the good times had to end, and wow, did they come to a brake-slamming emergency stop. A run of 2 points and just 3 goals from 7 games finished off the 22/23 season as the threadbare squad which could rarely rotate struggled to cope with fatigue. Worse still, a back injury to Player of the Season Ben Wilmot compounded the issue in breaking down a deep block.

This was all fairly reasonable in the minds of most, myself included. It was clear that Neil’s plan (at least as it showed itself in March) was a positive one, and one that had given lots of fans a big reason to buy in to a wave of optimism finally surrounding the club. Yes, the run had petered out with a whimper, but there was now a huge chance in the summer for Neil to bring in his own squad almost from scratch. This was a chance that very few managers get, to mould almost the entire club exactly as he wants it.

This was his chance to show us what he wants his team to be…

*Curb Your Enthusiasm Credits Theme*

The season started full of promise. A 4-1 victory over an admittedly poor Rotherham side was a shot in the arm for the fanbase. The new side consisted of 5 debutants and 2 returning loanees, but it was like they’d been playing together for years.

But very quickly there were worrying signs, and a week later Stoke were taken apart in a 2-0 defeat to Ipswich. The ‘all-action’ pressing approach that led to the halcyon run of Feb-April was clearly something that needed more time to develop among these new players. Ipswich were able to bait the press with ease, and play through Stoke as if they weren’t on the same pitch.

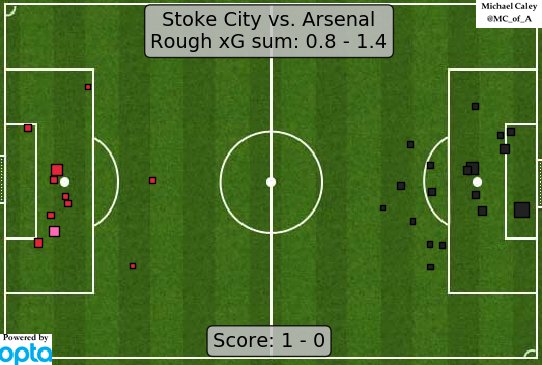
The aptitude of this pressing unit has become a very big issue in the opening 10 games of the season for Stoke, alongside a penchant for allowing attackers to turn in their own box and take a shot. Aside from a battling (and tactically strong) 1-0 win at home to Watford, Stoke were unable to add to their victories column until Gameweek 9, when a late strike from 18 year old Nathan Lowe sealed 3 points away at Bristol City in a very tight, and probably very lucky.

Prior to that game, Stoke were in 20th place, the same position they find themselves 12 games later having removed Neil from office.

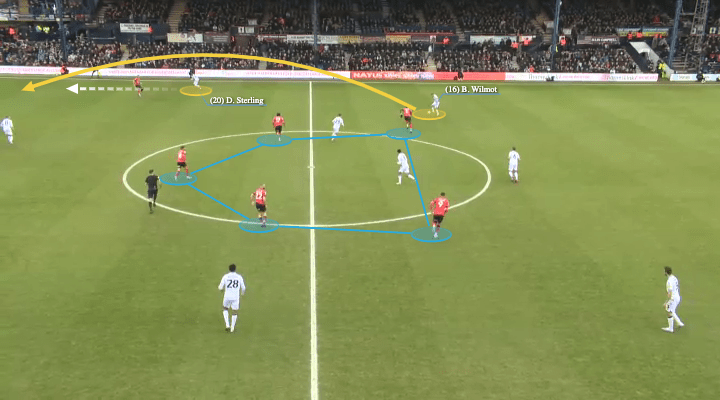
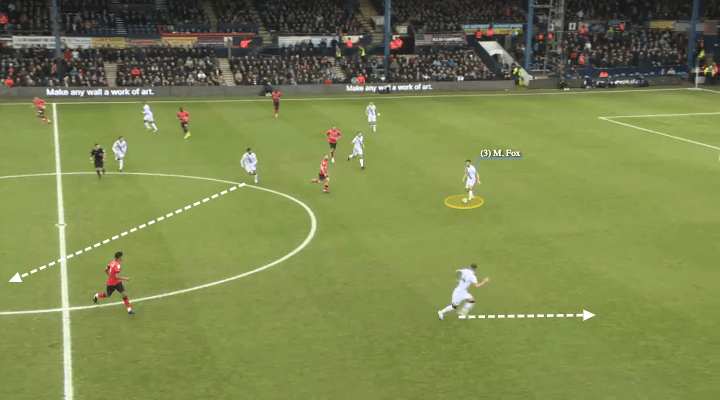
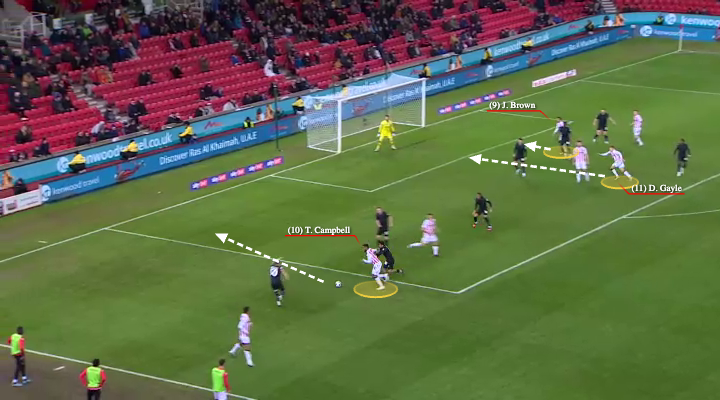
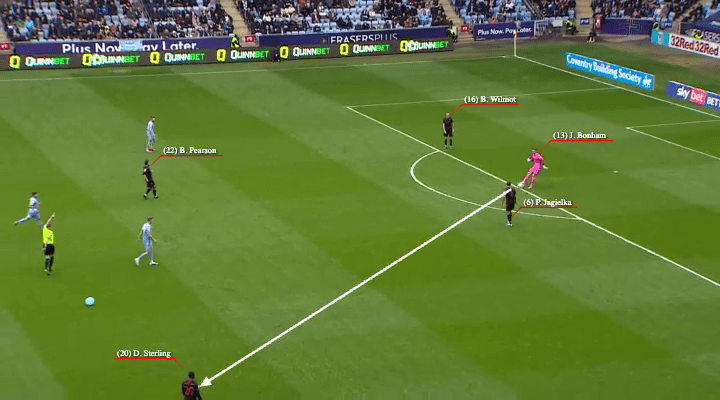
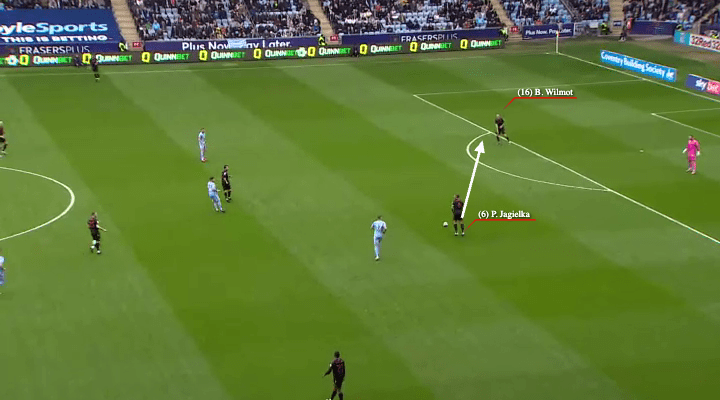
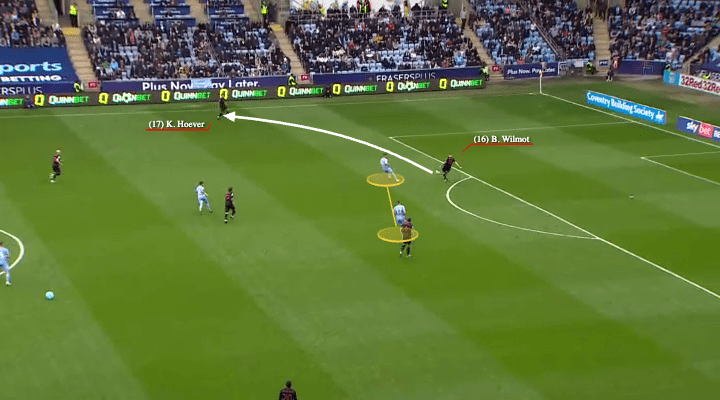
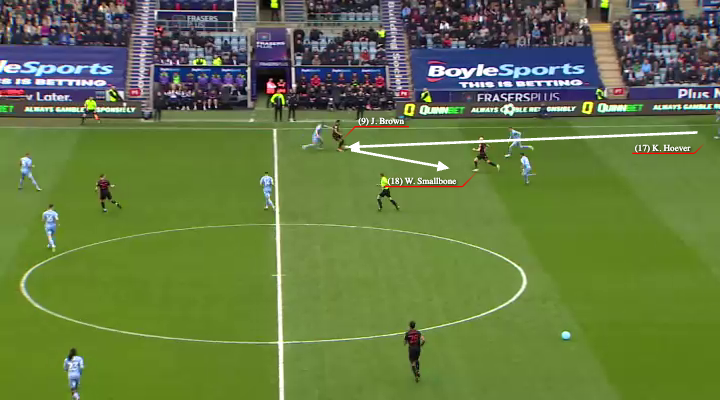
Among these starting few games were the seeds of Neil’s destruction, shown best with the following similar goals conceded by Stoke through that period.
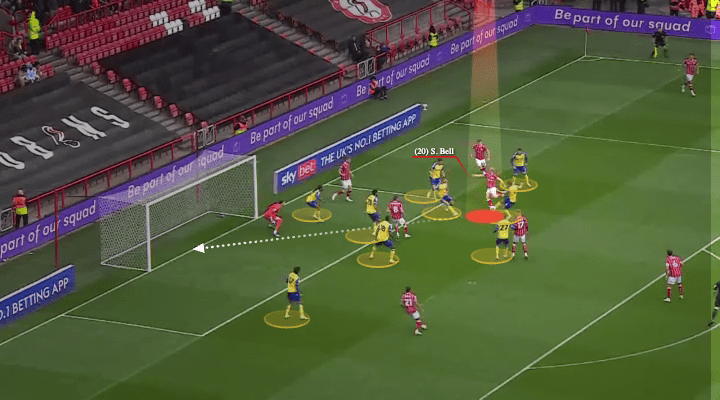
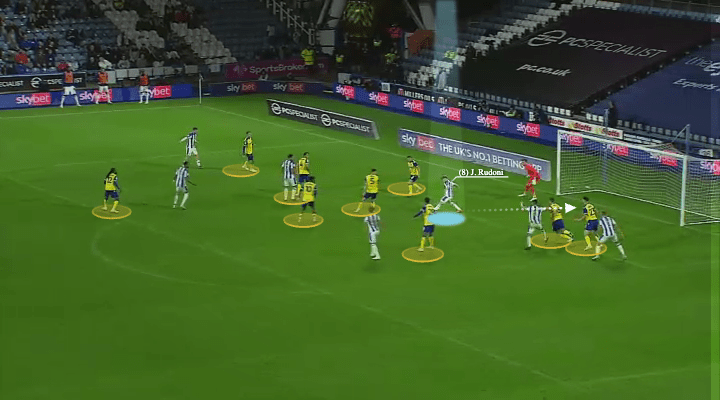
In each of the 4 situations above, the opponent highlighted was able to bring the ball down and get a shot away (all 4 resulted in goals) inside the Stoke area, within the width of the 6 yard box. In each of these cases, stoke had a minimum of 5 players in within 6 yards of the ball as the goalscorer received it.

‘Same old Stoke’, right? Well, yes. And this issue seemed to combine with a run of poor injuries to change Neil’s view on how Stoke needed to add points to their tally in the following weeks.

The ‘Good’ Run

A defensively-strong performance against Southampton saw Stoke go down 1-0 to a glorious free kick, despite a stonewall penalty claim being waved away for the Potters. The blueprint was set, as Stoke looked to pack the midfield and create a scrappy game whereby they might release counterattacks from second balls and hope to defeat other teams in small moments (remember this phrase).

Ignoring the Leicester game, with the many injuries and the embarrassing surrender with 2 banks of 4 stood on their own 6 yard box, Stoke stuck with this ‘crowd them out’ mentality in the midfield throughout the next 10 games, and here began the ‘good run’ which convinced many that the tide was turning.

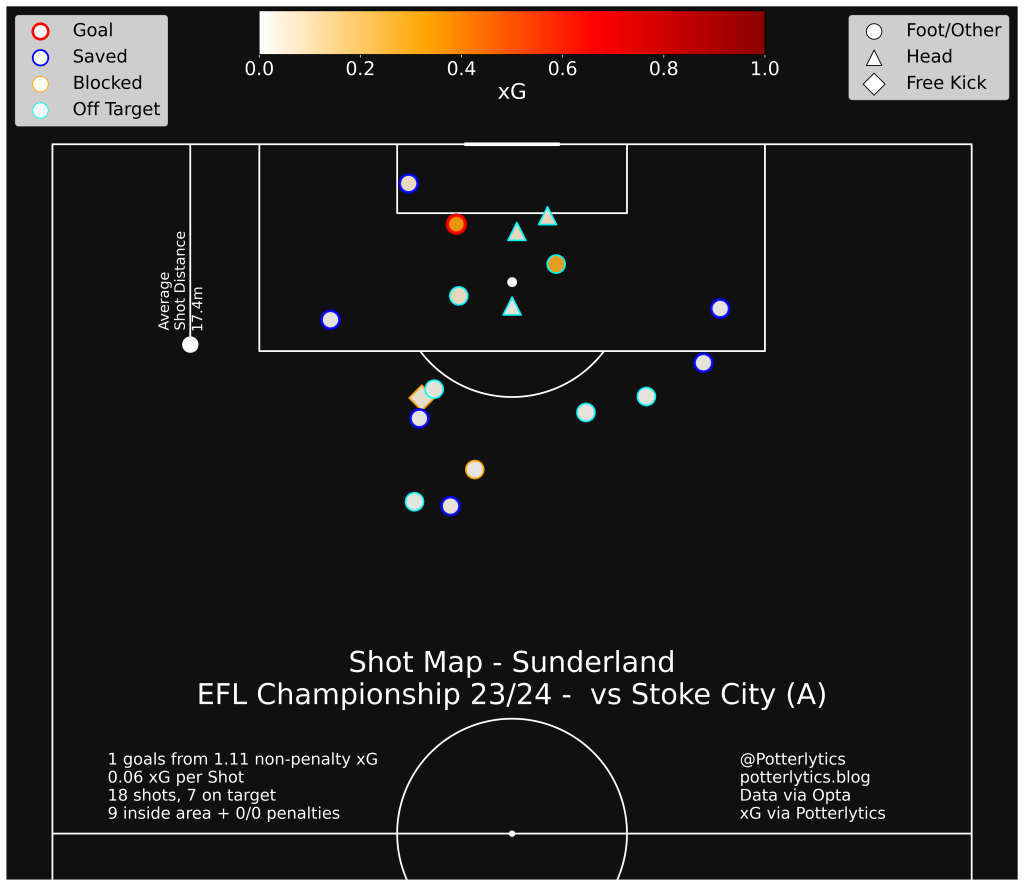
The 2-1 win at Sunderland was a nervy affair, in which neither team particularly dominated, and neither team particularly deserved to win.

Despite scoring 2 goals, Stoke’s attacking woes continued in the underlying numbers, and from the start of October to the end of November, they amassed only 6.5 xG from 9 games. In only one of those 9 did they achieve above 1 xG in a game, the 2nd dominant performance of the season away at Middlesbrough.

In the same period, despite conceding only 11 goals (4 of those in the final game of November vs QPR), Stoke’s opponents managed to create 13.4 xG, over double Stoke’s tally. It became clear that even though they had managed to pull together 3 wins from 5 unbeaten matches in this time, there was no sustainability to this run of form, unlike the highs of March.

The Middlesborough game was a rare joy. A match in which the press worked perfectly, Stoke’s build up was positive and sharp, and the 2-0 victory was well deserved. Leeds at home brought a rare return to the battling victories of old against higher-level opponents, with players throwing their bodies on the line, and a fantastically jammy set piece own goal bringing home the points. But even this joyous win and genuinely battling performance relied on Leeds missing big chances and a penalty.

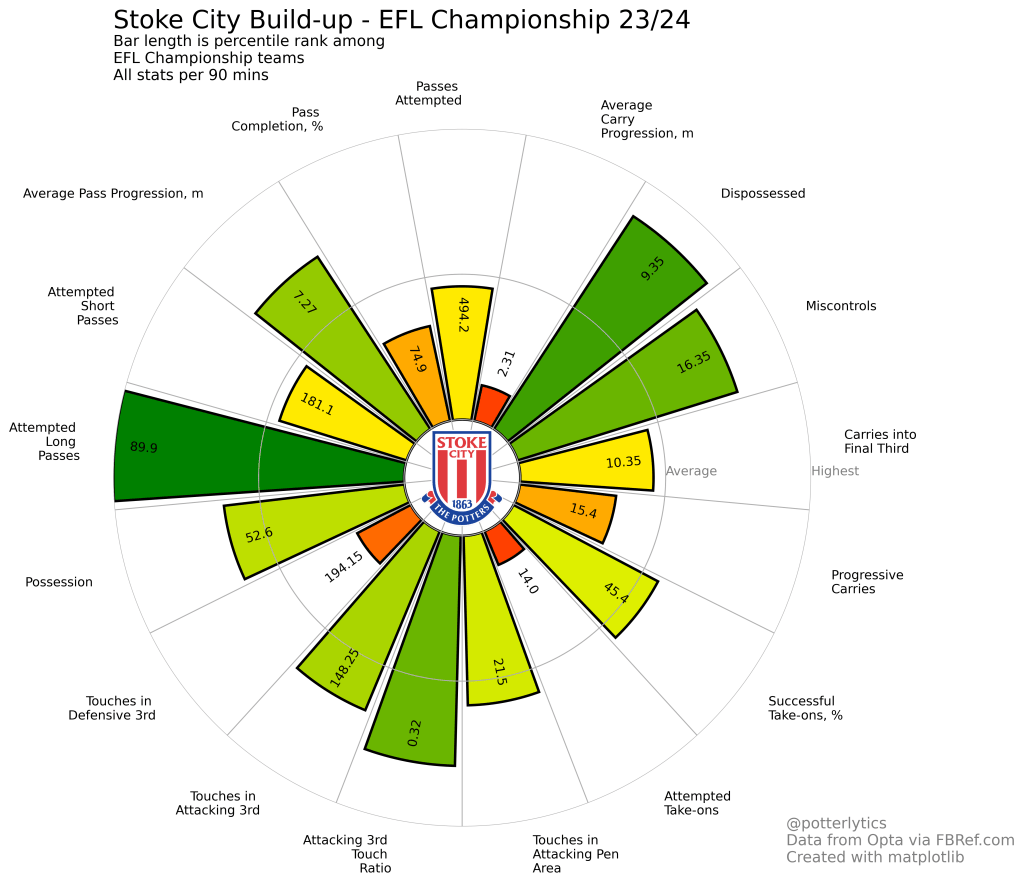
The strength of battling to save points in those 5 unbeaten matches was marked by a scrappy midfield, a lack of creative freedom, and a consistent lack of bodies willing to run ahead of the ball from midfield or in wide areas. The build-up became slower, more laboured, and consistently longer into forward players. At time of writing, Stoke have attempted more long balls than any other team in the league.

Stoke’s build-up radar. They attempt more long passes p90 than anyone else in the league, and despite having more possession than average, almost 1/3 of their touches are in the attacking 3rd, well above average for the league.

This longer build up was also true of Stoke last season, and reflected the will of Alex Neil to create overloads in the wider areas, which could be hit quickly, either by switches from defence, diagonal passes over the top of fullbacks, or line-breaking passes from centre halves. If all else failed, Jacob Brown (or this season, Mehdi Léris) made a good option for a flick on into a crowded area of the near side midfielder, the full back, and the striker, all ready to win the second ball.

This season, however, the passes into those overloaded areas have been slower to come, less varied, longer, and generally with fewer bodies around the ball.

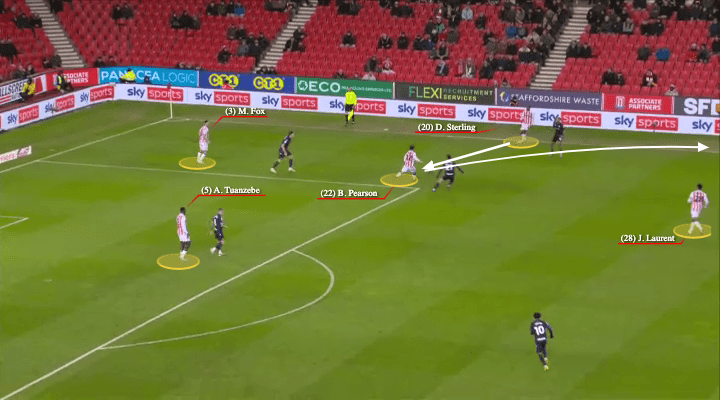
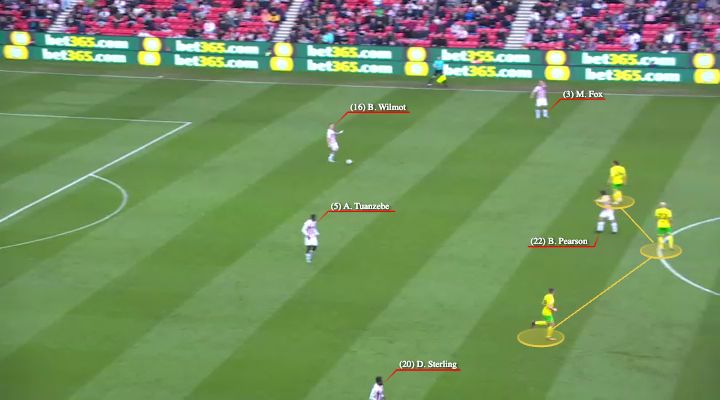
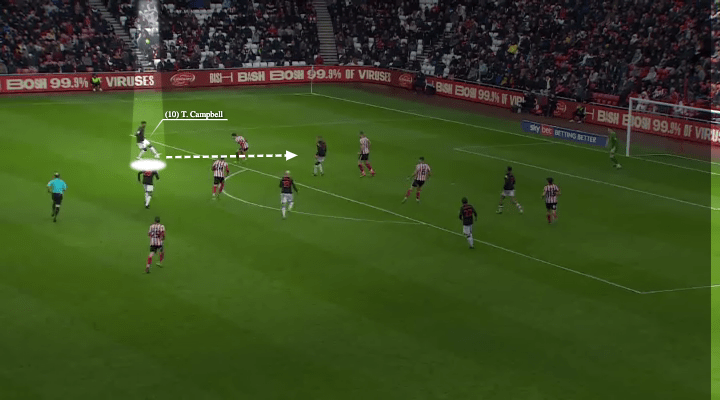
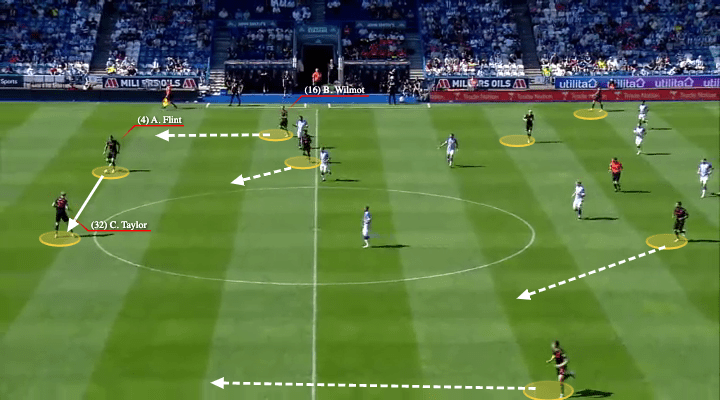
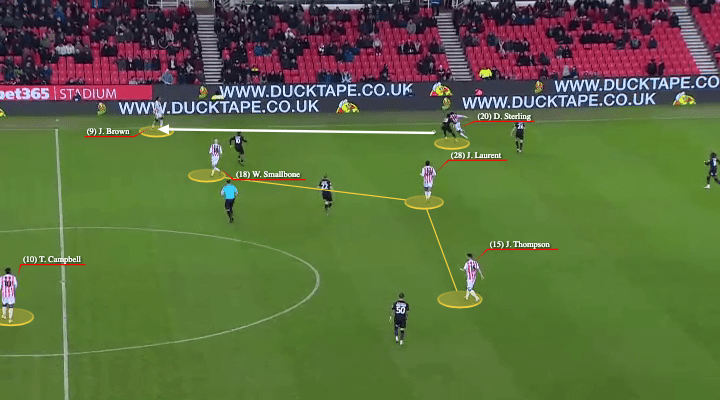
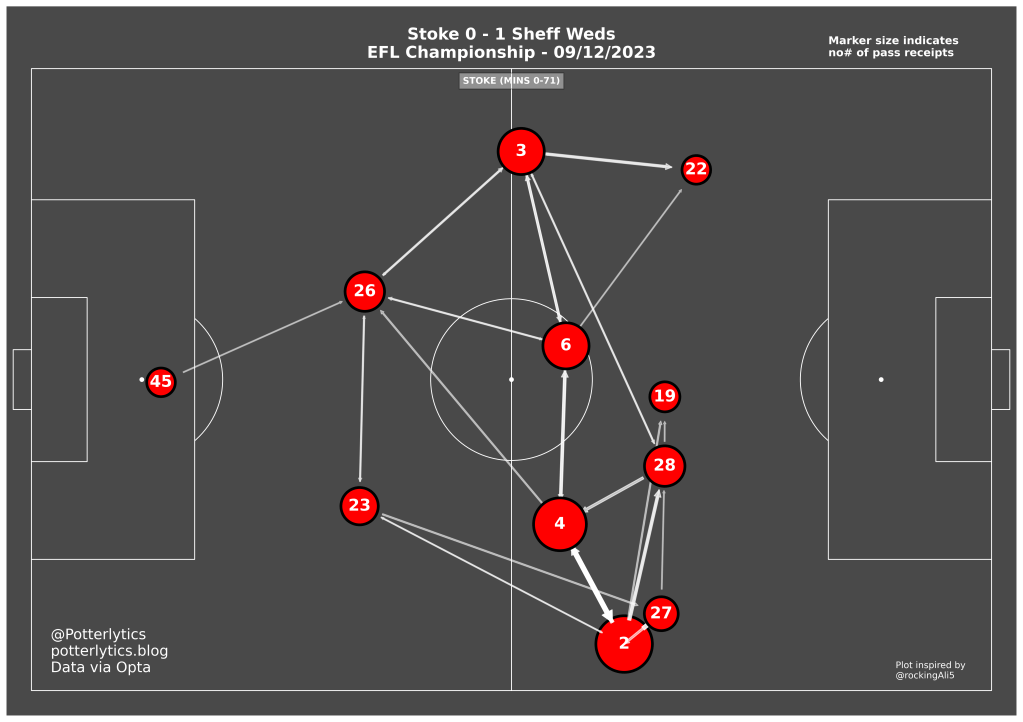
See the difference between the Rotherham game at home, and the Sheffield Wednesday game from Saturday below.

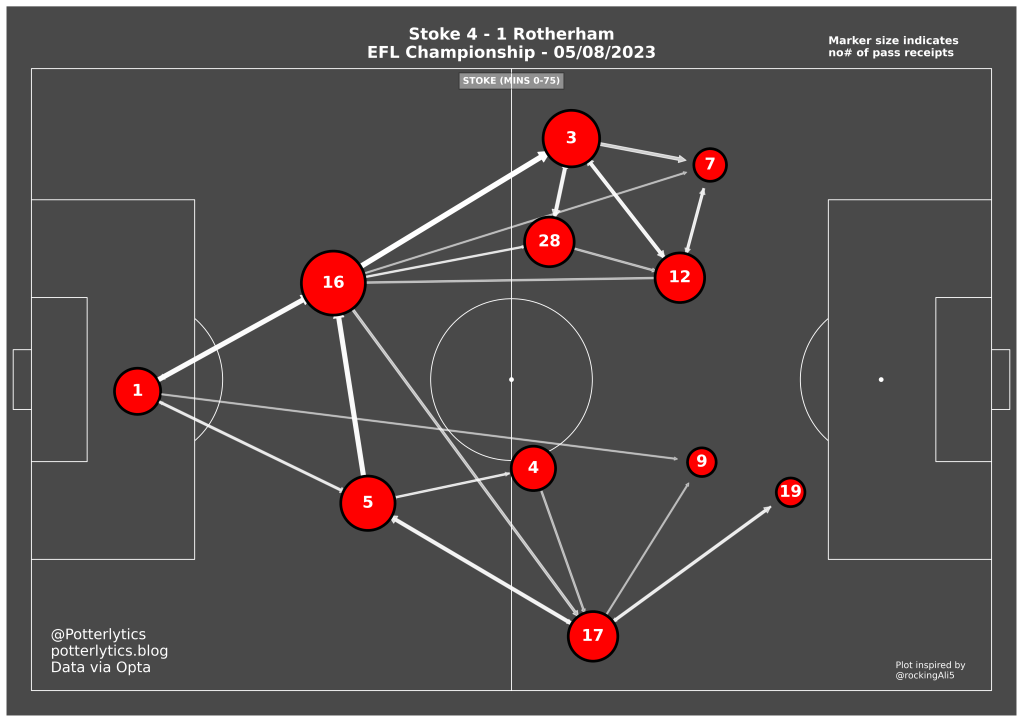
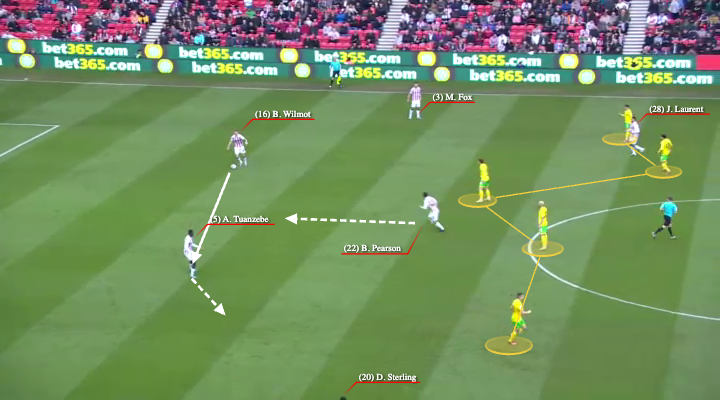
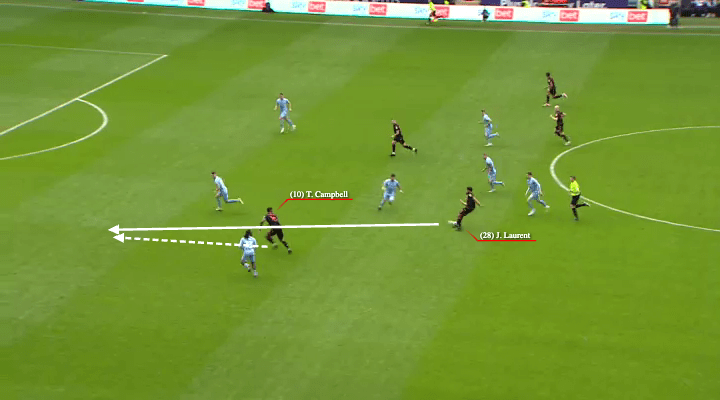
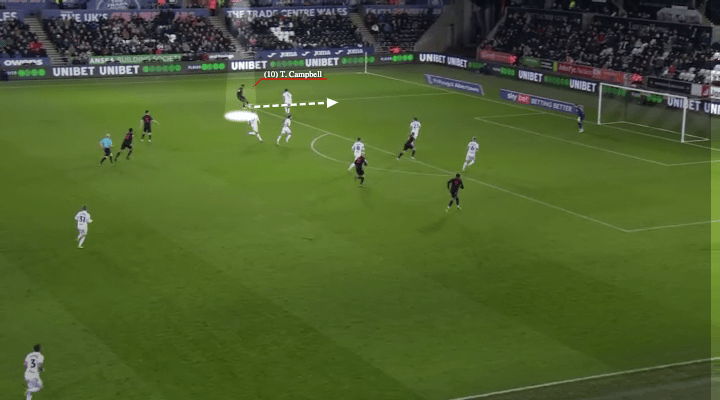
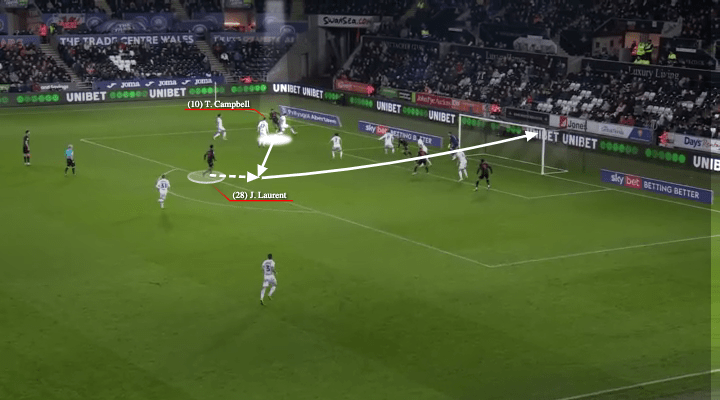
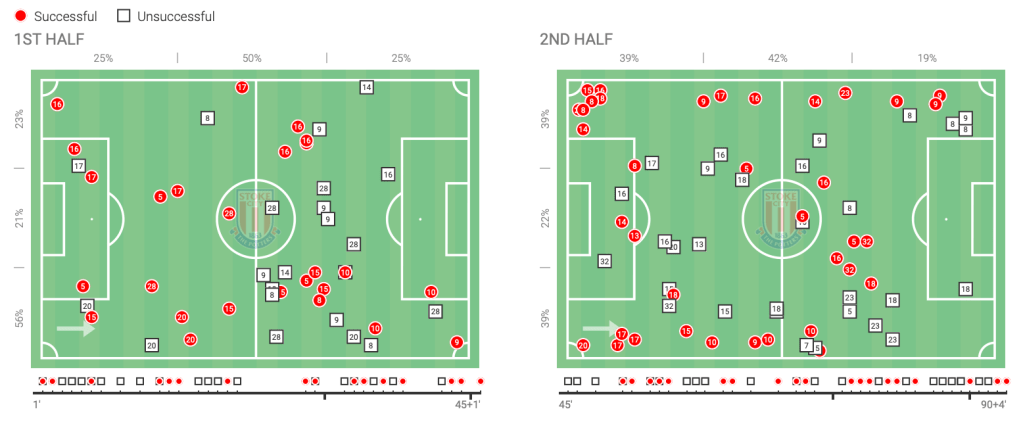
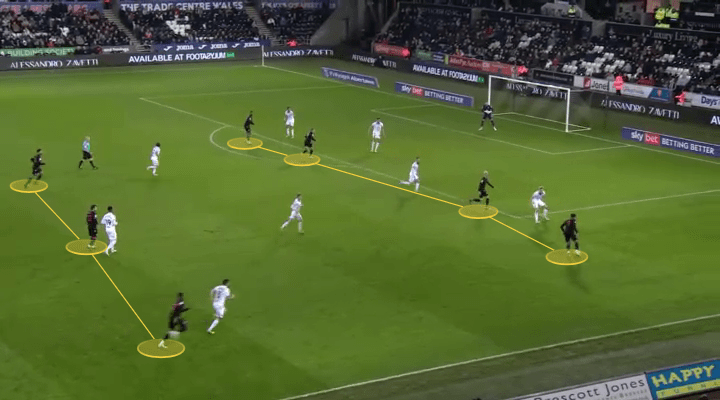
Against Rotherham we see two clear areas, left and right, where players often interlinked to provide overloads. On the left wing we have Stevens pushed high into the opposition half, with Laurent, Johnson and Vidigal connected closely to support progression of the ball. On the right wing, we see Hoever further forward, with Pearson supporting from slightly further away, and Brown/Mmaee pushed higher to run in behind.

The small arrow to Brown from Travers indicated those longer passes as an emergency outlet. Note that in this game both centre backs played a range of progressive passes into midfield and full backs (Wilmot to Hoever in particular was a huge progression route for Stoke).

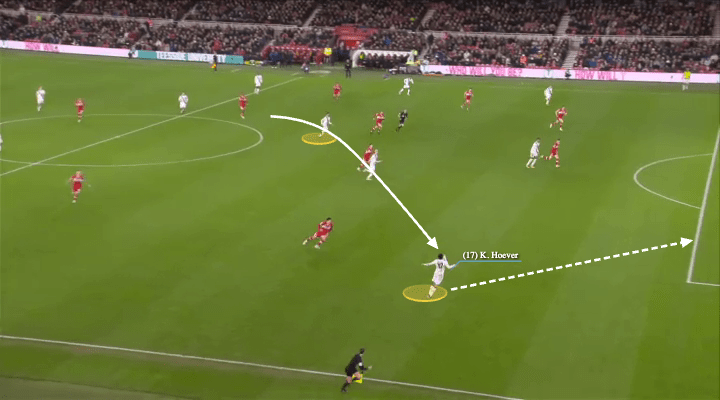
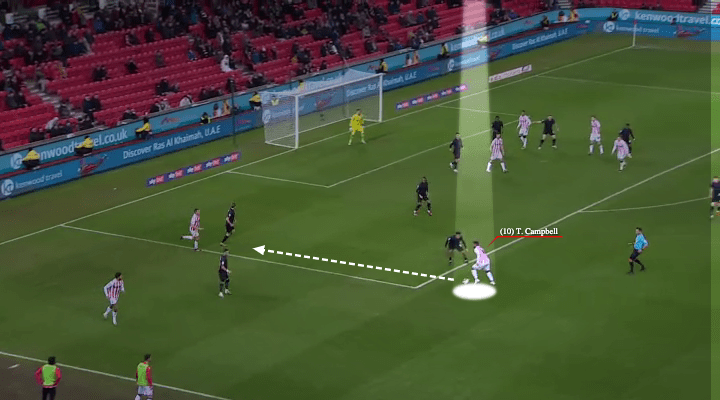
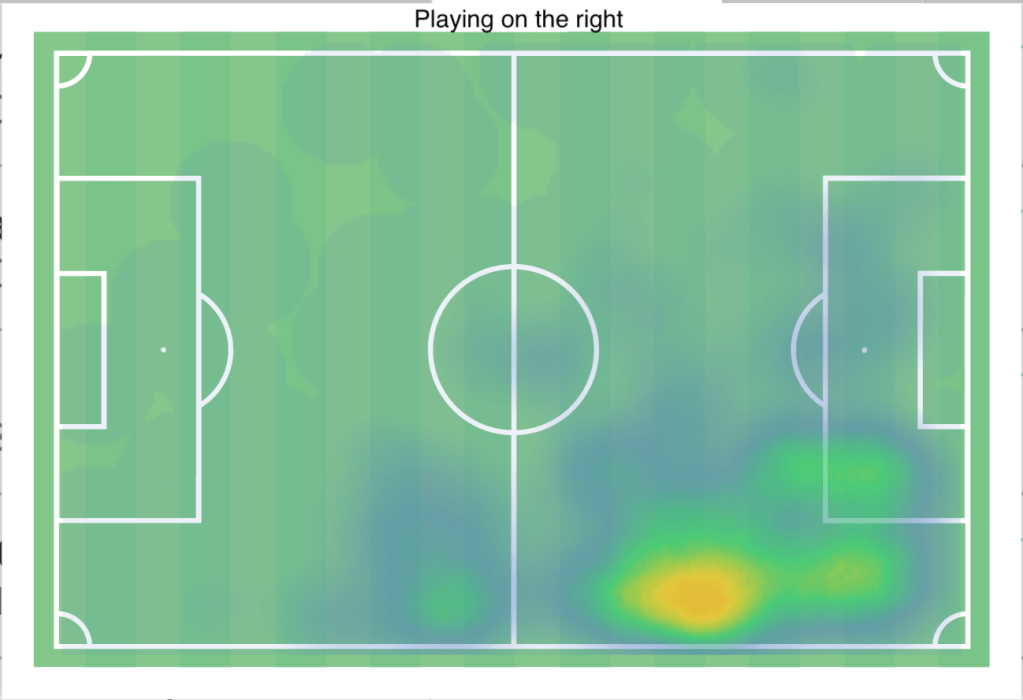
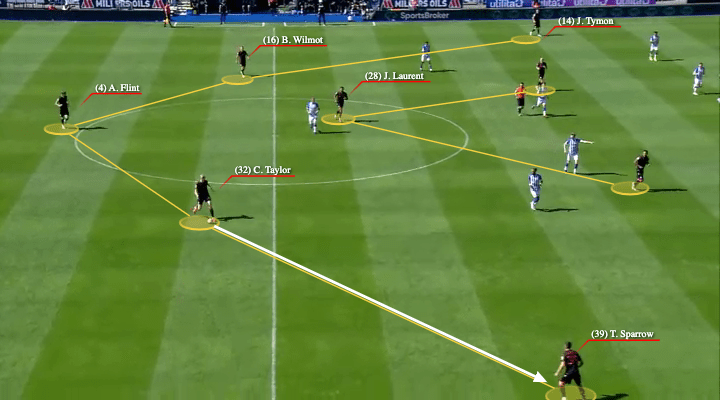
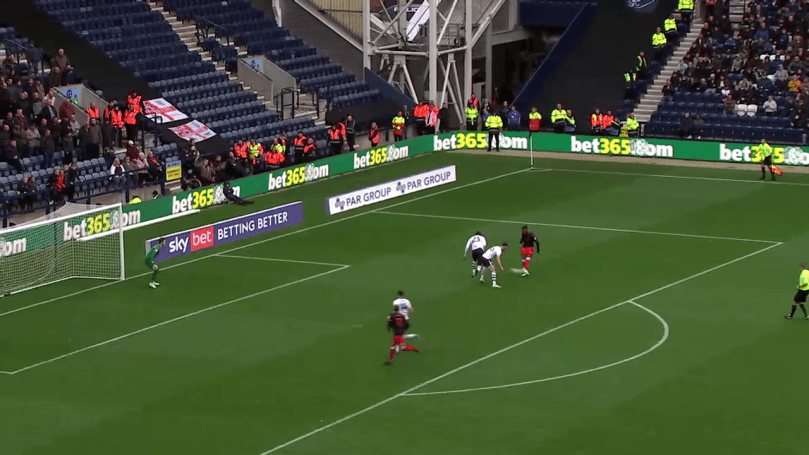
Against Sheffield Wednesday we see much less cohesion. Both centre backs contributed less to the build up, and more passes went straight down the line to full backs. Gooch and Léris were in similar average positions, and Bae Junho was almost entirely on his own, relying on straight balls down the line from Stevens.

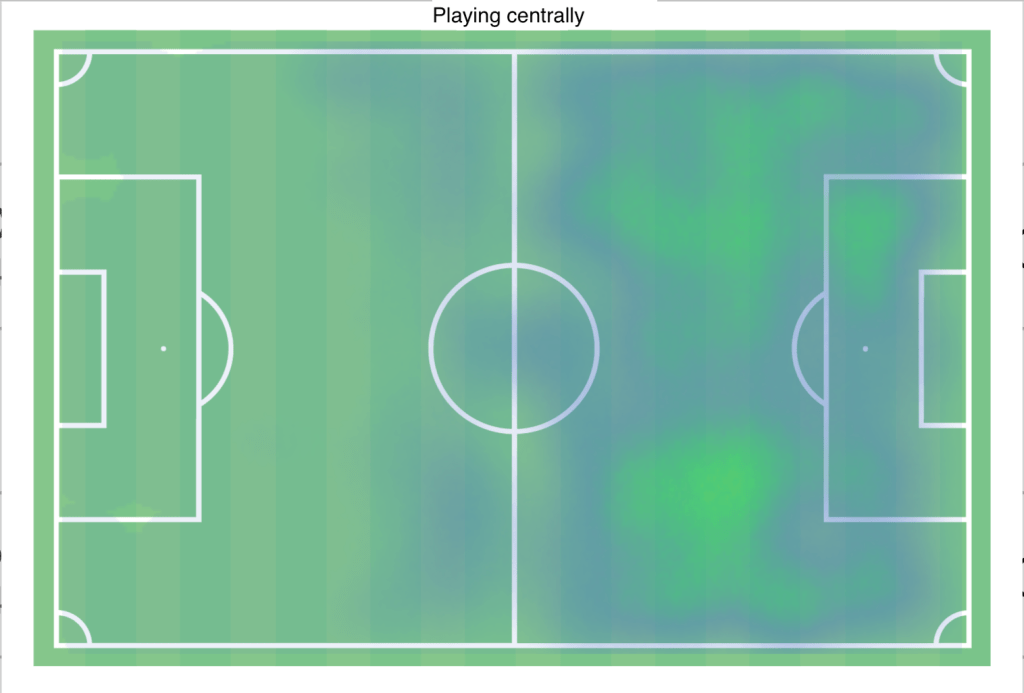
In fact, throughout the season, midfielders have been receiving the ball in deeper and deeper areas as the games have passed.

Positions of received passes by centre midfielders. The thick white line indicates the median height at which passes were received.

On average, players in central midfield are receiving the ball ~6 yards deeper in the last 10 games than the first 10. The biggest issue here for me is not necessarily that they’re involved in build-up in deeper areas, that can be fine, but that they’re much less involved in higher areas of the pitch.

Last season we regularly saw Smallbone, Laurent, and Baker pop up in higher areas of the pitch to help create and finish off chances. These last 10 games we’ve not seen nearly as much of that. On the plot, this shows up as the squares around the half spaces near the box, which are much less bright in the second image.

Alongside this, centre midfielders added less xT (I know, I’m sorry, it’s a measure of how useful possession is, but for the purposes of this it basically means their average pass didn’t move the ball as close to the goal as it did before) in their passes in the last 10 games.

The end points of successful passes made by Stoke City centre backs. The thick white line indicates the median height at which passes were received.

The same is seen in the passes made by our centre backs. In the second plot, we see that fewer passes make it into half spaces across the halfway line, and far fewer make it into the central areas just inside Stoke’s half. The indication here is that Stoke’s build-up is much less likely to break the initial line of the opposition press by playing into the midfield than it was early in the season.

All this supports the thesis of Neil struggling to fix the defensive issues of the early season, and as such he tried to step away from his centre backs playing into more risky areas, instead preferring to allow centre midfielders to drop deeper than the opposition press, and hoping the real creativity would come from quick breaks or high regains.

‘Front-Foot, Aggressive Football’?

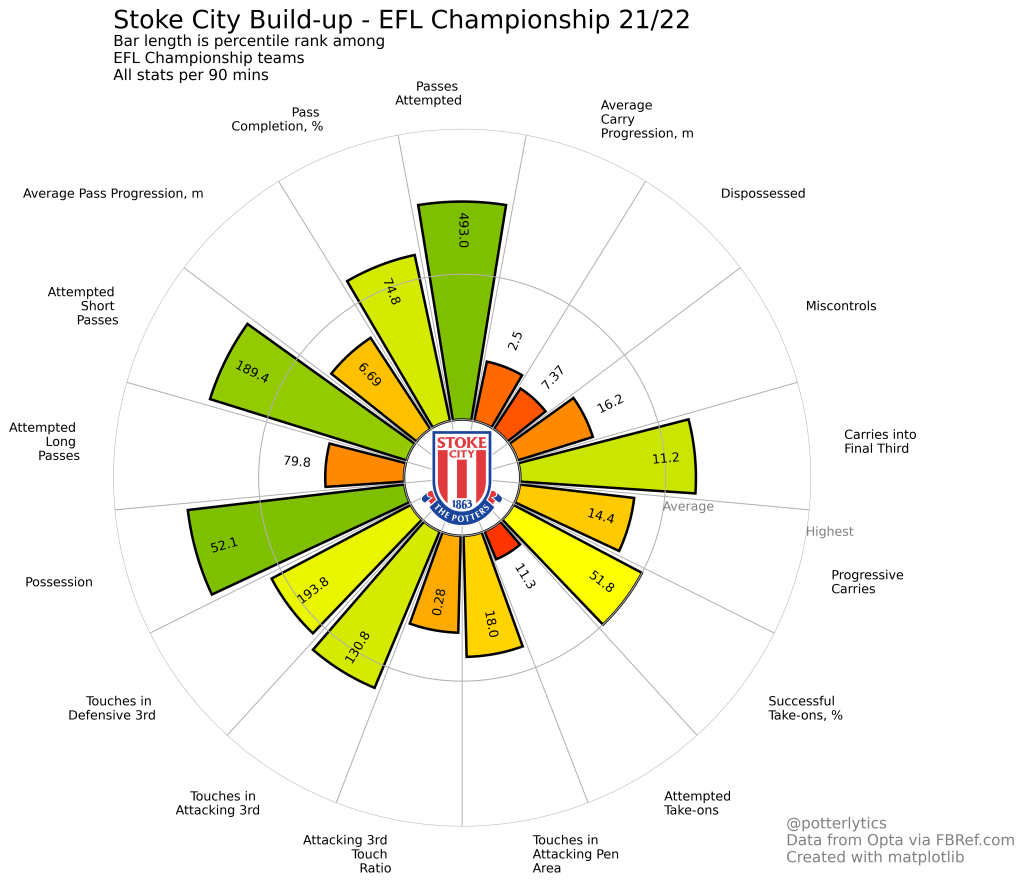
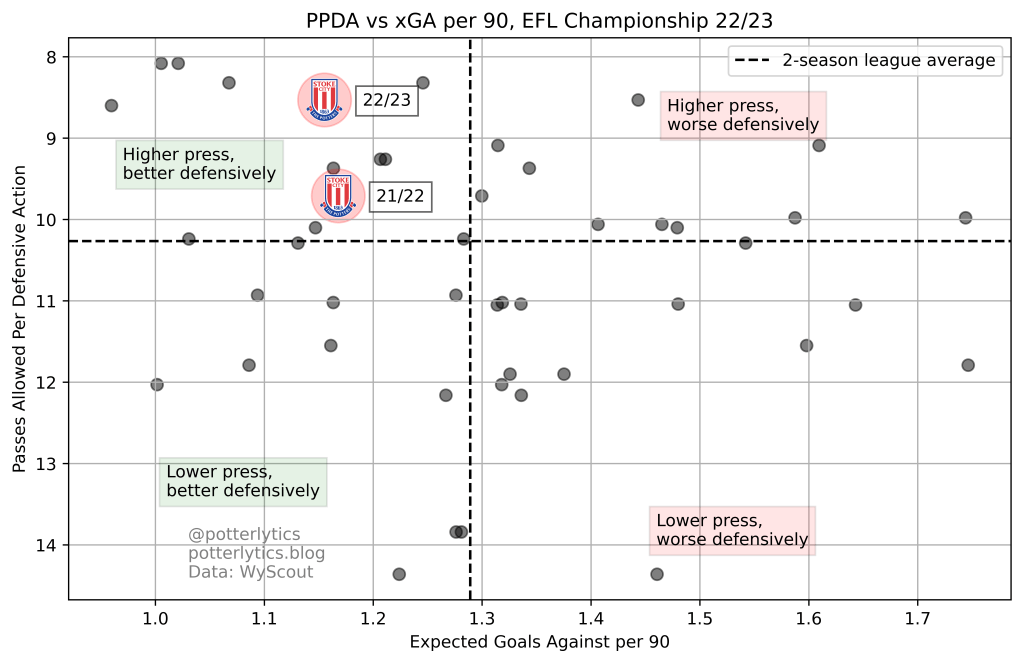
Stoke’s high press has actually been pretty good this season, and they’re still one of the most aggressive pressers in the league. Stoke’s PPDA (how many passes they allow the opponent to make before making a tackle/interception etc) of 8.98 is the lowest (i.e. the most aggressive press) in the league. They make the 5th most attacking 3rd tackles of any side, and have the highest duels, tackles and interceptions per minute of opponent possession.

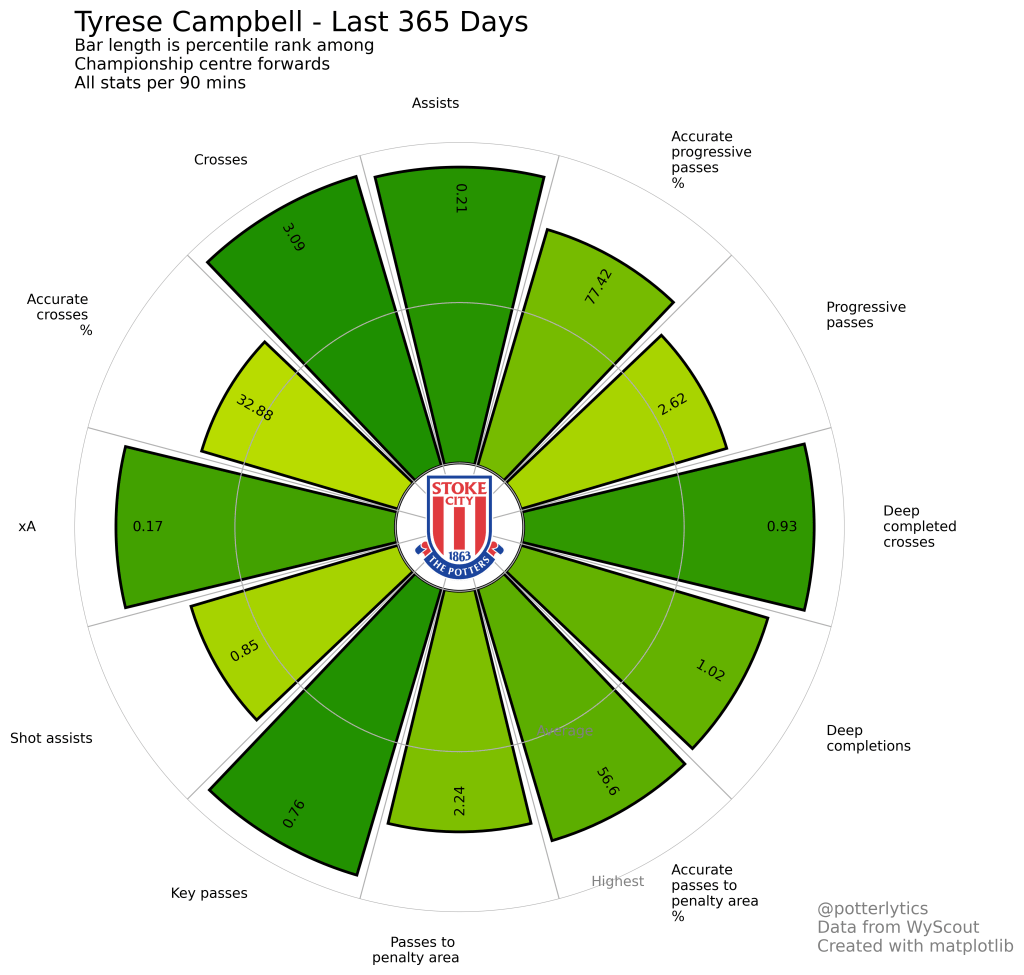
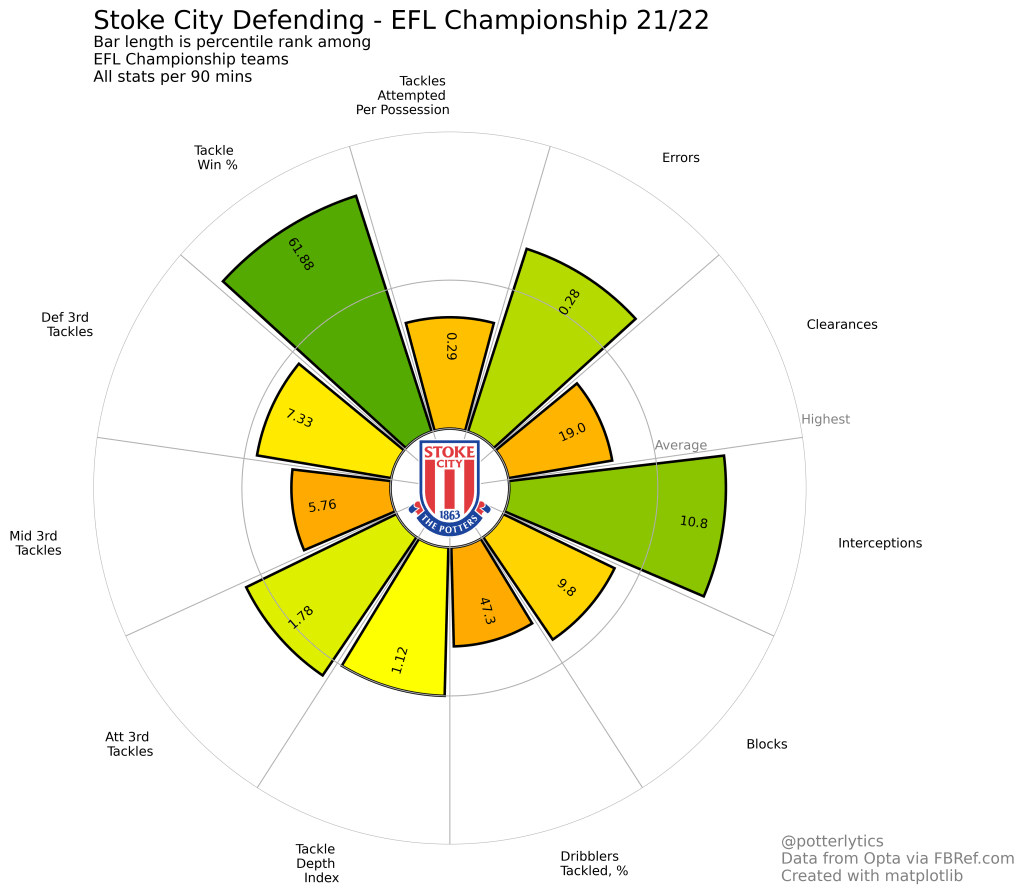
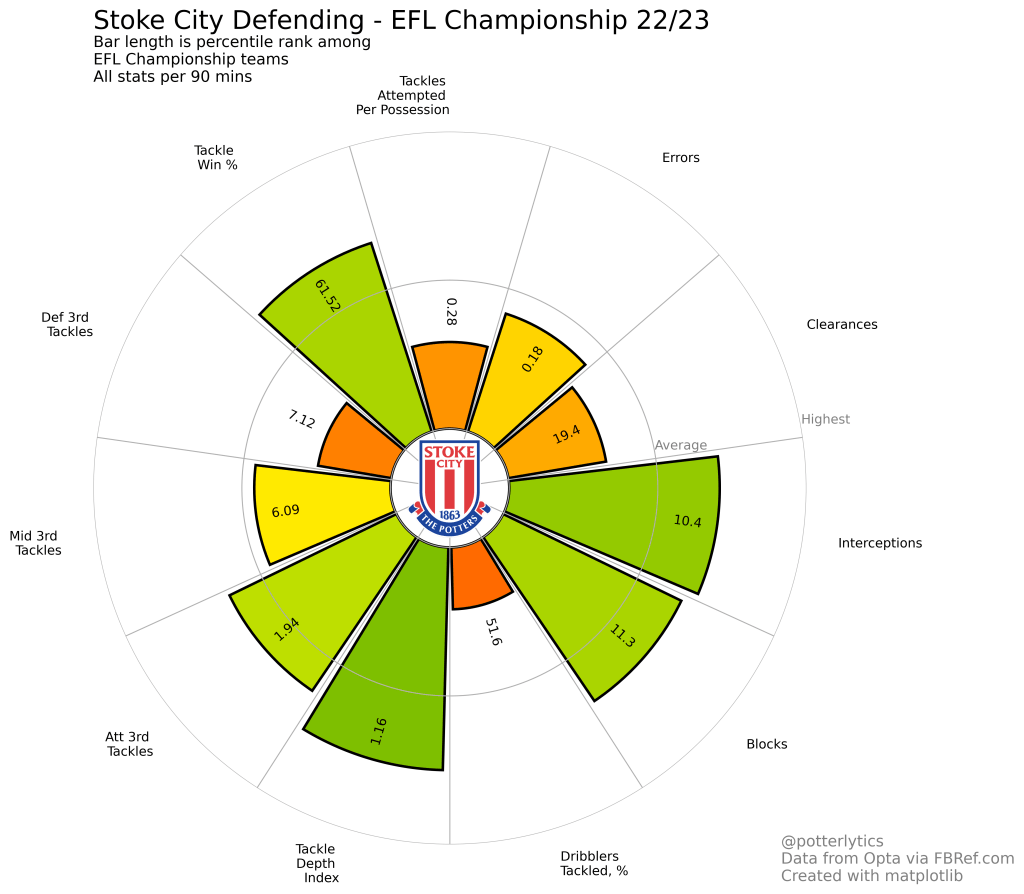
We can see this in the two radars below.

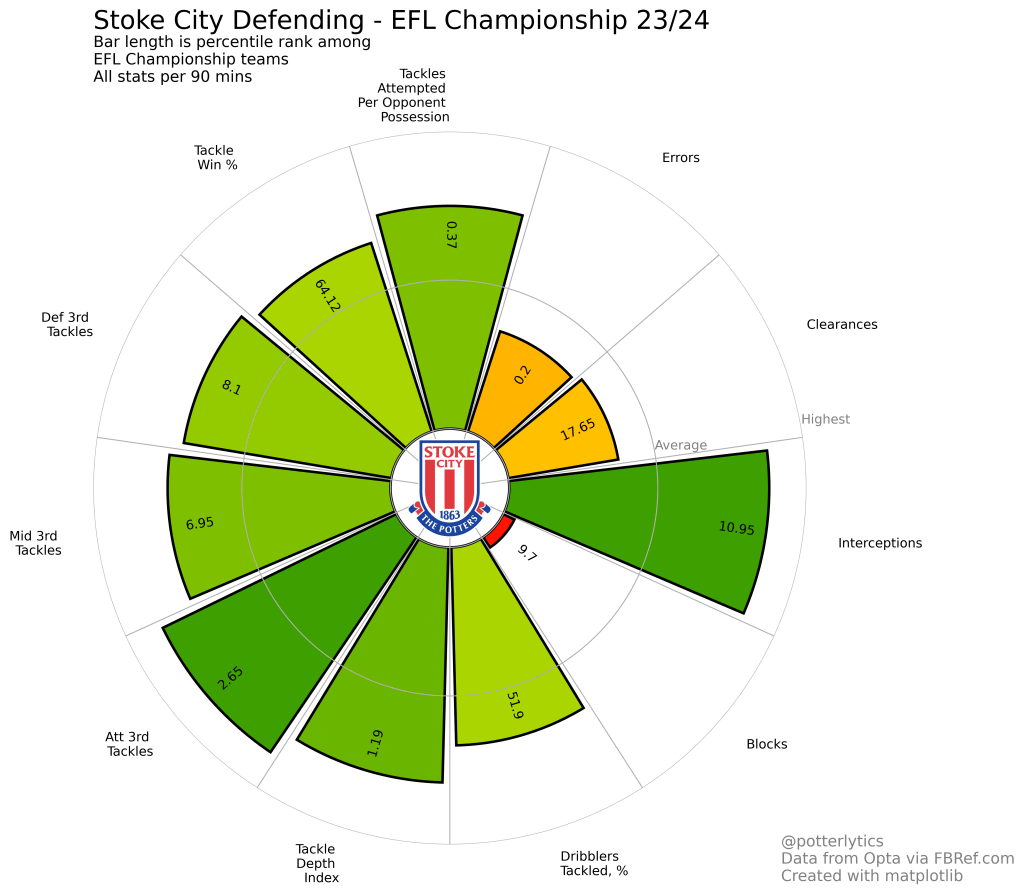
In the left-hand radar, we see that Stoke make lots of tackles and interceptions, lots of tackles high up the pitch, and a larger-than-average portion of their tackles are high up the pitch.

Similarly, in the right-hand radar, we see that opponents playing against Stoke have few touches in the attacking 3rd, a very low pass completion, and a lower-than-average attacking 3rd touch ratio (number of touches in attacking third/total number of touches).

Stoke are still good at pressing, although their numbers have fallen a little in the last few weeks.

Despite this, Stoke have yet to score a goal from a high turnover all season. From 124 of these occurrences (2nd only to Leeds), 28 have ended in a shot, the 5th highest number in the league. The lack of a true goalscoring threat from this key part of Alex Neil’s ethos has further compounded the attacking woes, and couldn’t cover up the defensive errors as well as they had earlier in the season.

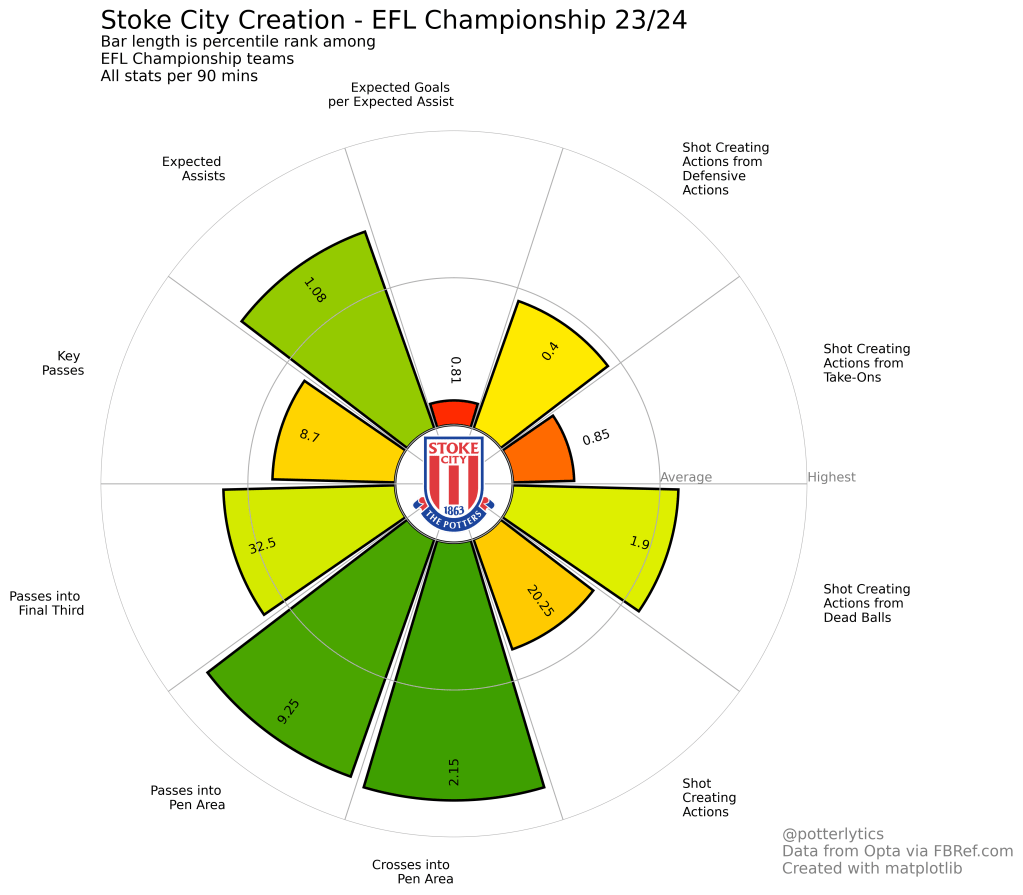
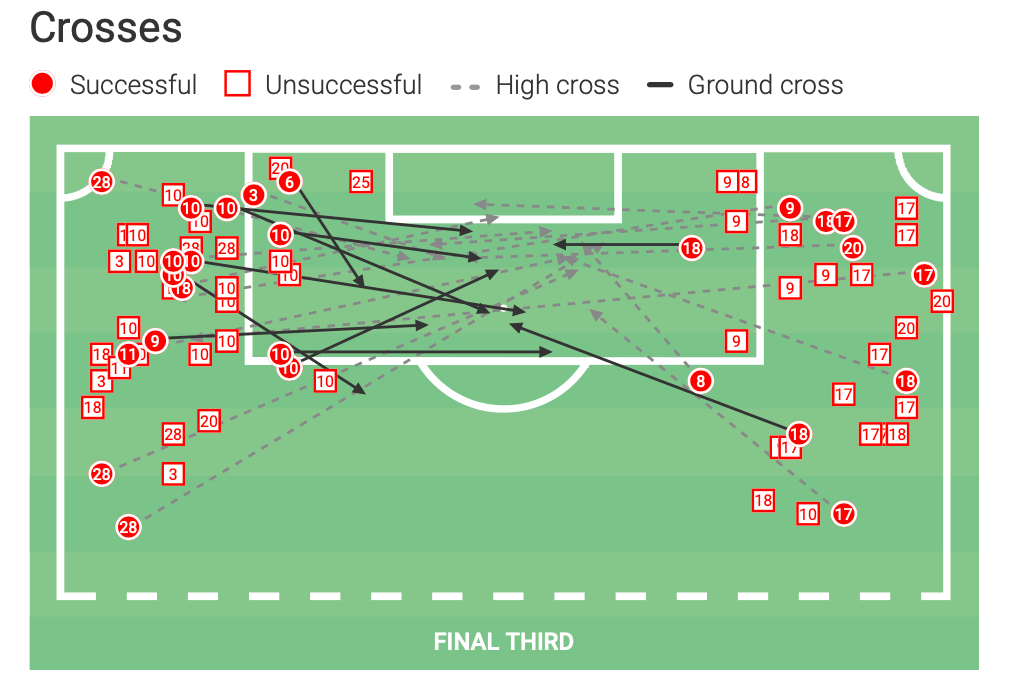
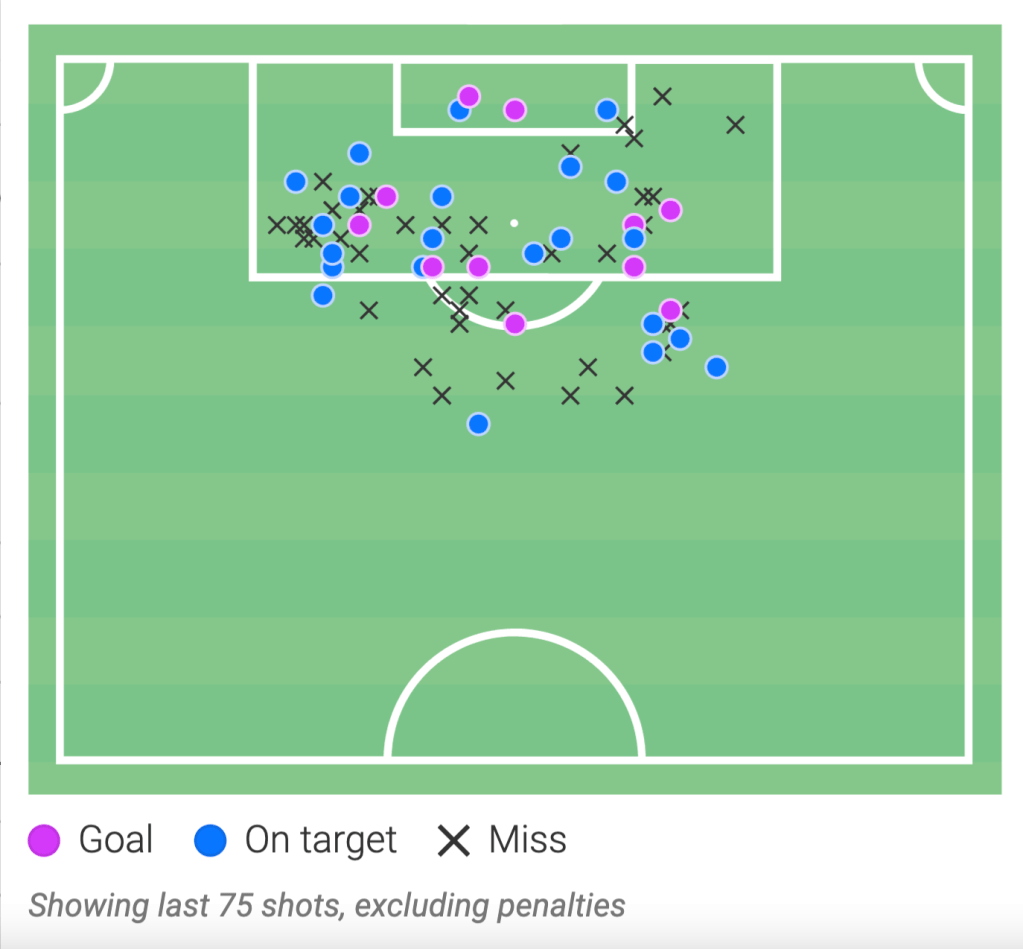
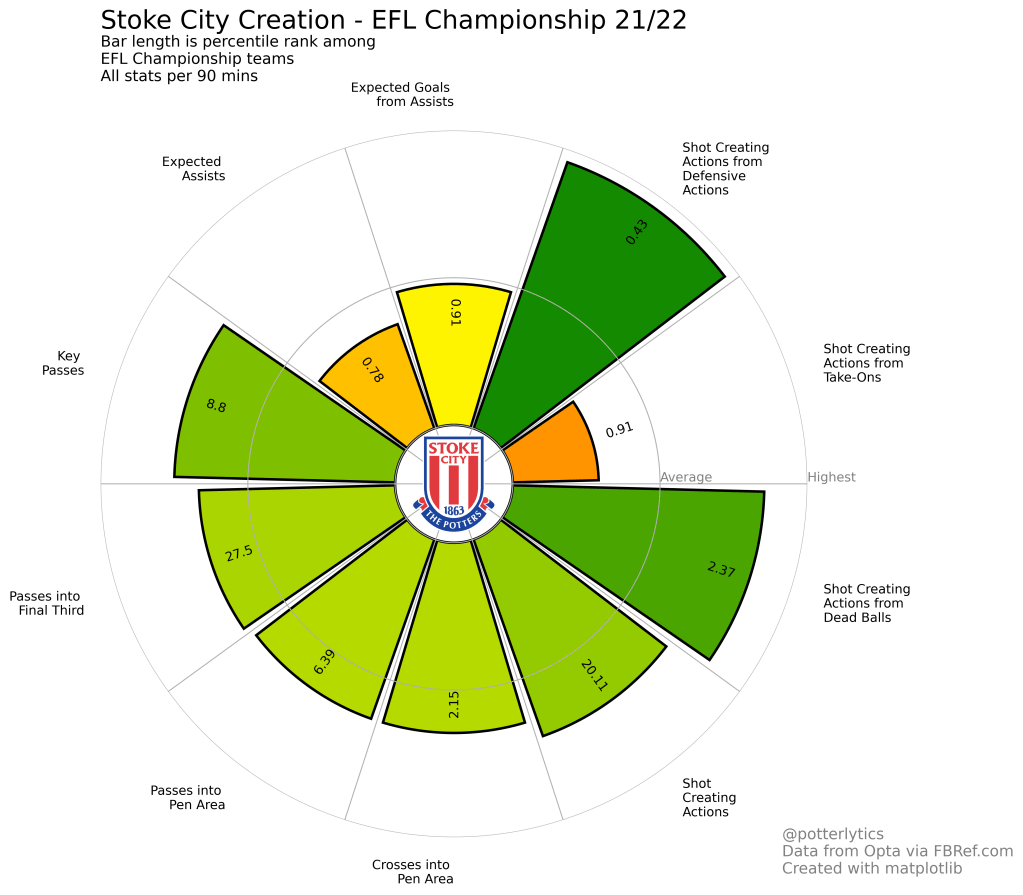
The creativity they do have comes often from throwing the ball into the box and hoping to pick up the resulting pinball. They put far more crosses than average into the box, and pass the ball into the area more than average too. But from this relatively high ‘expected assist’ value (how likely a pass is to result in a goal from 0-1) comes a very low conversion into xG. The xG per xA section of the radar shows that Stoke are among the poorest at the league in turning balls into good areas into high value chances.

There are two possible issues that can cause this, and I think Stoke fall foul of both, but more likely the overriding issue is the latter of the following problems.

Firstly, your shooting players could be poor at getting into those good positions, or poor at turning good passes and crosses into shots. Secondly, but more pertinent for Stoke in my opinion, you can be putting a high volume of low-value balls into the box, inflating your expected assists value but converting very few of these deliveries into good chances. This is supported by the high number of crosses and passes into the box, and an xA value that, despite being above average, is still lower in league rank than the volume of balls into the box.

Crosses are a pretty low-efficiency way of scoring goals, and that becomes even more inefficient when you don’t have lots of bodies in the box as in Stoke’s last 10 games. Compare this to the high value chances created by cut backs in March’s run, and we see a huge difference in the efficiency of Stoke’s attacks.

‘The Malaise Is Deep’

Thanks to John Percy for that turn of phrase. It really does describe the club perfectly.

Although Neil can point to several games where Stoke were on the wrong end of little mistakes, his classic line of ‘we just need to be on top in those moments’ still rings in the ears of every Stoke fan who could stand the post-match press conferences after a loss.

But at some point, you have to look into why so many of these games have been decided by small moments. The Championship is a very scrappy league, with games often decided by tiny margins, but the issue with Alex Neil’s 23/24 Stoke side is that they forced games to be this way in the last 10 weeks or so.

It’s seen perfectly in the Sheffield Wednesday game. Yes, Stoke should’ve scored a (very dubious) penalty. Mmaee and Junho Bae probably should’ve scored big chances too, but Sheffield Wednesday were given a chance to win with Stoke’s lack of control on the ball and unwillingness to play through the lines.

The scrappy nature of the match, enforced by a lack of confidence on the ball, a lack of sharpness in passing, and a midfield 3 tasked with battling their way through the game, was the reason that moment existed for the opposition.

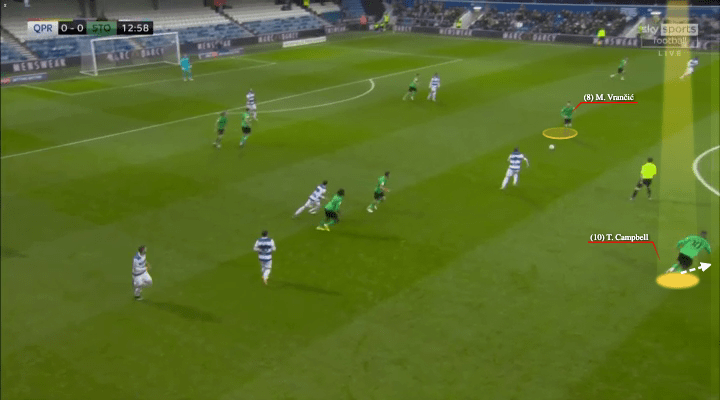
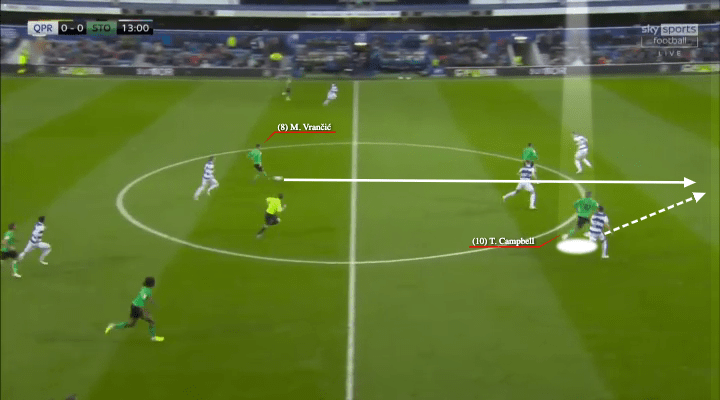
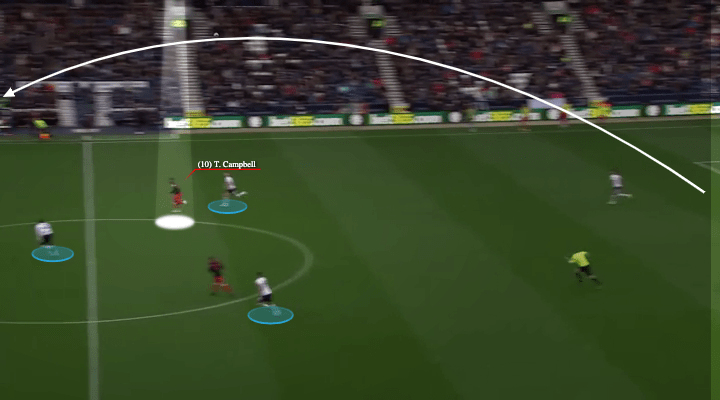
Even the games in which Neil appeared to make attacking changes, namely vs QPR and Plymouth in which a front 4 of Vidigal, Mmaee, Campbell and Junho started, appeared more out of desperation to stop the attacking rot than a true plan.

The front 4 did create more chances against these two defensively weak opponents, despite often appearing to be left to their own devices in terms of how to break down the opposition. But even this relatively conservative attempt to let some technical players do some attacking immediately led the return of defensive woes, with the team conceding 4 (from > 2 xG) to a QPR side that had only scored 12 goals all season by that point.

And So It Begins… Again… Again…

And here you find us again, returning to the managerial market, like an addict trying to find that one hit of dopamine that will make everything great again.

I’ve been clear in my views before about the model of the club, and it will be very interesting to see if the de-facto ‘long term dudes’, in Ricky Martin and Jared Dublin, will survive contact with the next manager who walks through the door. Martin made it clear in the summer that the aim was for Stoke to build with a core ethos of ‘high tempo, aggressive, front-foot football’ in the mould of February to April’s run of form. It was even more clear that there was very little consideration that Alex Neil might not be able to deliver that.

Given the previous willingness of the owners to allow a manager to tear up the foundations of the club as soon as they are announced, any new boss may be likely to have a veto on pretty much anyone in the club. It may depend how much of Ricky Martin’s spiel has been bought into by John Coates, but the dice gets rolled again, and maybe this time we’ll get lucky…

My last post on here ended with a genuine ‘Bravo, Alex’ after the Watford win.

This one will end with a slightly more sarcastic line.

Bravo, John.

xG per game, 20 game rolling average, since Summer 2017.

Thanks to any and all readers, and please feel free to comment and follow on Twitter at @potterlytics.

Should you wish to donate to help with the running costs of the site, and the data subscriptions we use, please feel free to visit our donations page here. Any and all help is very much appreciated!

George

Anatomy of a 10-game Revolution (Part 2) – The On-Ball Boogaloo

Part 2: Chance Creation and Build-up Play

Welcome back, to those of you who just read Part 1, looking at sustainability and off-the-ball work, and to those who didn’t go and check it out here (Anatomy of a 10-game Revolution (Part 1) – Stoke’s New Blueprint)!

You join us as we look into Stoke’s remarkable turnaround since February, and to reiterate the context here, let’s look at a brief table.

First 30 Games – Before Huddersfield – HLast 9 Games – Huddersfield – H – Onwards
xG For per 90 mins1.132.10
xG Against per 90 mins1.130.90
xG Difference per 90 mins+0.00+ 1.20
Data from Opta via FBRef

You might say that this could just be a lucky run of fixtures, but as we mentioned in Part 1, this run includes games against 4 of the top 10 most in-form teams in the league, and Stoke’s 10-game rolling xG difference has been above +0.5 for 8 matches now.

Last time we looked at how Stoke’s work off-the-ball work has contributed to this improvement in the underlying numbers, particularly in winning the ball high up the pitch, stopping opponents in their build-up phase.

This time, we’ll look into how Stoke have ramped up that xG for stat, through their own build-up play, and the way they look to create their chances.

If You Build It…

First up, let’s look into Stoke’s building from the back. In a very strong interview during the Sheffield United away game, Alex Neil said the following:

“I thought first half we wanted to try to play and open the pitch out, and to be honest we did that to Sheffield United’s benefit rather than ours.”

“We got a lifeline before half-time by getting a goal, changed it at half-time by not risking it at the back and getting the ball forward, on the front-foot, up against them and aggressive.” [BBCSport]

It appeared that Stoke’s building phase was over, dead and buried, Rest in Peace (2022-2023).

Sure enough, in the following league game, a 4-0 victory over Reading, Stoke did exactly as said in the previous game. They had only 38.1% possession, and the trend continued against Luton in the next game.

Click each image to zoom in

In this clip, Stoke have a free kick just inside their own half. Baker plays the ball short to Wilmot, and we see the plan for Stoke.

Immediately Sterling and Gayle start to bomb forward, and Wilmot clears the ball long into the channel.

Click each image to zoom in

This clip tells a similar tale. Fox receives the ball 20 yards into the Stoke half. As Tymon drops deep to support, Laurent runs forward in the midfield to get into an area of space.

Fox immediately throws a long pass into the left hand channel, unfortunately this time it ends up in Luton’s possession.

So how has this changed over the past couple of months?

Well, let’s look at the two major build-up plans that I think I’ve been able to pull from Stoke’s recent matches.

…Wins Will Come

Click each image to zoom in

This time we look at a Stoke goal kick in their home game against Blackburn. The two centre backs, Fox and Tuanzebe, set up within the penalty box to provide a pass for Bonham. Pearson is in a deeper role centrally to provide an option during the next phase.

The ball goes to Tuanzebe, who plays it across to Fox. This draws the first line of Blackburn’s press, and two forwards close down the centre backs.

Fox turns and puts the ball wide to Sterling, and Ben Pearson moves deeper and wider to provide support. At this point, Blackburn’s first line of press has been beaten, but they have forced the ball wide, and would probably feel like it’s going okay for them.

Click each image to zoom in

As Pearson drops to support, Sterling plays it across to him, and this is where it gets interesting.

Up to this point, the tempo has been relatively low, Stoke have been playing the ball across calmly and baiting the press forwards.

But Pearson immediately shifts the tempo and puts the ball forward with a high pass towards the halfway line. Note: High pass, aimed towards a specific forward/area where forwards should be, not a hoof like some of the passes we saw vs. Luton.

The switch of tempo and pass beat the press, and Gayle nods the ball back into the path of Tyrese Campbell, into a large space in the centre of the pitch.

The slow tempo passing in the previous two images created this space, by drawing those Blackburn midfielders forward. This is a controlled line-breaking move, known by some as an artificial transition. This allows Stoke to attack a defence that isn’t set, and has spaces available to attack.

At this point, Campbell bombs forward to the opposition box, and plays in Will Smallbone for a high-value chance.

Note how the 2nd image here shows Campbell, Laurent and Smallbone immediately bombing forward as Gayle wins the header. This was a crucial part of Stoke’s build-up in this game.

Interestingly, though, this specific routine isn’t necessarily something Stoke do every match, but as with the press we spoke about in Part 1, the principles remain the same throughout.

Let’s take a look at this build-up from the 0-0 draw at home to Norwich.

Click each image to zoom in

In this game, Norwich dropped into a fairly flat mid block, to prevent Stoke from finding space in between the lines. This is intended to stop the artificial transition mentioned in the last clips, by denying space and forcing Stoke to try to play into areas where Norwich have numerical superiority.

Stoke again play the ball calmly and at a low tempo, with extra space to move into towards the halfway line. Wilmot plays it across to Tuanzebe, who moves wider while Pearson drops into the centre of defence.

This allows Tuanzebe, a very press-resistant centre back, to move forward into space on the right hand side. He exchanges passes with Pearson and moves into that space.

Click each image to zoom in

Tuanzebe moves into that space, and we see the compact mid-block shape of Norwich in the first frame.

He waits until the attacker presses the ball, and then plays a pass forwards into makeshift-winger Hoever. Note the movement of Brown, ready to get into position for the next pass in the move. This forward thinking is crucial to breaking down a tough block of compact players.

We also see that Stoke are very wide in possession. Pearson dropping into the quarterback role allows other players to spread out, and we see that despite the ball being on the near touchline, Fox and Campbell are still very wide on the opposite side of the pitch.

Hoever receives the ball and plays it down the line into Brown’s path. Again, We see Smallbone and Campbell running into positions again to receive the next pass or cross.

Again, we follow the same principles as before, drawing the first line of pressure as much as possible with lower-tempo play, then switching quickly to higher-tempo passing, forwards into the midfield or frontline, followed by runners consistently supporting the ball, thinking one or two passes ahead to get into position to receive.

Now in the Coventry game we saw more evidence of another build-up plan, in which Stoke get the ball forward much more quickly into areas of the pitch where they can win first and second duels. This takes advantage of the combative nature of Stoke’s starting XI.

We can see in the plot below that all of Stoke’s forward players are above average in at least one of ‘offensive duels per 90’ or ‘aerial duels per 90’.

Reminder that this is just one indicator, check out our player radars to find out other stats such as success rates! (Player Stats)

In this case, Stoke are looking to a much more simple plan, but still sticking by the same philosophy.

Getting the ball forward into aerially-strong players like Brown and Powell allows Stoke to crowd an area of the ball, where strong, combative players like Smallbone, Hoever and Laurent can win the second ball, again forcing a transition-like phase of play.

This again means Stoke can attack a defence that isn’t set, and aided by quality, high tempo passing alongside quick attackers, they can exploit the extra space available.

We come to the 3 main principles of Stoke’s build-up:

  • Lower the tempo to tempt the opponent to press if possible.
  • Quickly change the tempo to expose spaces in the opponent’s lines, either with line-breaking passes or balls to strong aerial threats.
  • Get bodies into good positions to receive the next passes.

And while build-up is great, there’s no reason to do any of it unless you can create chances! So how do Stoke go about doing the hardest thing in football – scoring goals?

Now For The Fun Bit

We see these principles merge into Stoke’s chance creation, particularly in the specific (if vague) philosophy of exposing spaces.

But, when Stoke do manage to generate either a true transition, by winning the ball high up the pitch, or an artificial transition through build-up as above, we do see some specific areas that the team look to exploit more often.

Most interestingly in my view, I want to speak a little (a lot) about the xG-geek’s favourite – the cut back.

You may have seen Arsenal and Man City utilise this type of chance a lot over the cause of this season, and there is a specific reason teams target this kind of chance.

Most important of these is that shots from this area are very high-value, in terms of xG. Cut-backs are also ground passes, and tend to be taken first time, both of which are factors which increase the historical likelihood of scoring.

An xG model based entirely on location of the shot, we see that central, close shots are of the highest values. Credit: https://www.datofutbol.cl/xg-model/

It was incredibly surprising watching footage back of recent Stoke games, just how many of Stoke’s recent flurry of opportunities have come either from traditional cut-backs, or similar ground-crosses to the area around the penalty spot. For the rest of this piece, I will refer to both types of chances as ‘cut-backs’ for ease.

Using the 1v1 skill and quality in creation of left-winger Tyrese Campbell, Stoke look to expose the right hand side of opposition defences. The ability of Campbell to go either inside or outside a defender means that 2 chances can be created by getting him on the ball wide of the box.

First off, we see the specialism of Campbell, the cut in and shoot to the far post (see the work on the Ty-phone Zone here). But more recently we’ve seen that he has been focused on moving outside, down the line, and cutting the ball back towards the penalty spot.

But there are issues. Cut-backs move the ball into areas that teams work very hard to defend, so there are likely to be lots of defensive bodies pressuring the shooter, decreasing the likelihood of scoring.

Stoke have a very interesting way of helping increase their chances despite this, and it involves the impressive rise of Will Smallbone and Josh Laurent.

Let’s look into the second goal away at Swansea, a clip also analysed in our Josh Laurent Profile.

Click each image to zoom in

Campbell has the ball at the top of the screen, on the corner of the Swansea box.

He stands up the right back, and we see movement from Smallbone, Brown and Gayle, the 3 forwards, into the 6 yard box. These runs are crucial as the Swansea players are forced to track deeper towards their own goal to mark.

As Campbell beats his man on the outside, these runs into the 6 yard box open up space behind the front line, where Josh Laurent is waiting. The cut back comes, and Laurent powers the ball into the net.

The forward players drag the defenders deeper, opening up space. This is one reason we’ve seen an increase in the number of shots (and goals) from Smallbone and Laurent in recent weeks.

The same happened for Laurent’s finish against Sunderland, as below.

Image: Wyscout

Stoke break forward down the right hand side quickly after a drop ball in their own box.

As Smallbone gets the ball, Gayle has moved onto the edge of the six yard box, taking the defender with him. The quick break forward means Sunderland’s back line is out of shape, leaving space for Laurent to arrive late and finish the move with a goal.

Finally, we can see the move for the 2nd goal at home to Huddersfield, at the start of the run of form.

Click on each image to zoom in

Campbell again has the ball on the corner of the box, but this time Stoke are facing a very set defence, having just taken a corner. In the box there is a 6v4 in Huddersfield’s favour.

Notice that as Campbell starts his run down the line, to create the cutback opportunity, Dwight Gayle and Jacob Brown immediately sprint to get into position in the six yard back to drag those defenders back and make space.

Click each image to zoom in

As Campbell gets into position to play the pass into the box we again see the space created by Gayle and Brown pushing the defenders into the six yard box. This time the pullback comes to Brown, who cleverly drops off the defenders.

After a short scramble and a good save, Brown finishes the move to put Stoke 2-0 up.

We see, looking at the last 5 games of Stoke’s crosses, a big clump of left-sides ground crosses. Most of these are from Tyrese Campbell.

Data from Wyscout

In the last 5 games, Stoke have amassed over 2.1 xG just from crossing, according to Wyscout.

In the most recent game, away at Coventry, we saw yet another chance from the same type of cutback.

I won’t explain each bit frame-by-frame again, but here’s Smallbone’s 0.4 xG (Infogol) chance in the first half. Created by winning the ball just inside the opposition half, Laurent plays the ball to Campbell, and the magic commences.

Click each image to zoom in

Now I’m not joking when I say I can find at least another dozen examples of this exact move in the last 5 games. There is a really specific drive to create this type of chance from Stoke.

But that’s not all Stoke do! This specific tactic is one among many, but all follow those basic principles we spoke about earlier. Trying to unsettle and attack a disorganised defence is paramount, and we can see some examples of this in other big chances Stoke have created recently.

Central Perks

We’ve focused on Stoke’s attacking through wide areas, but the propensity to create transitional attacks against disorganised defences, alongside excellent passing quality in the midfield and forward lines, can also lead to Stoke playing large numbers of line-breaking passes through or from the middle of the pitch.

Let’s take a look at a few examples.

Click each image to zoom in

Stealing again from the excellent, informative Josh Laurent profile posted here last week, we go back to the Middlesbrough away game, where Stoke pick up the ball in Middlesbrough’s half, and Hoever bombs forward into space.

Laurent’s quick thinking and quality in pass allow him to deliver a raking ball over the top of the Boro defender, and Hoever goes on to score.

Again we see the same principles that I’ve exhaustively told you about. Quick transition, bodies forward, play the dangerous ball at high tempo to expose uncertain defences.

Click each image to zoom in

This time we join the Sunderland match towards the end (as you can tell from the stands).

Tymon wins a loose ball back after some nice play from Stoke, and twists past one player to come inside.

He plays a reverse ball through for Gayle who now has a good chance. The keeper makes a save but this is a positive attacking move from Stoke, even late in the game.

Finally, let’s see the whole process of building through artificial transition, surpassing a press, and scoring a goal, come together in this clip of the first goal vs Coventry.

Click each image to zoom in

Initially we see a similar start to the examples above in the blog. Stoke calmly pass the ball about in the back line, drawing the two Coventry strikers forward. As the space opens up, the ball moves wide to Hoever, who plays a powerful ground pass down the line to Brown.

Image: Wyscout

Brown pins the defender behind him, and lays off a pass into the path of the oncoming Smallbone. Now Stoke have exposed some of the space we spoke about above, and are in a position to attack a disorganised defence.

Click each image to zoom in

The ball moves wide to Campbell, a little later in the move, and here we see another pillar of the Stoke philosophy, clever movement from lots of bodies into the box. Brown points out where he wants the ball, makes an exceptional run in between the disorganised full back and centre back, and Campbell curls the ball perfectly into his path.

Again, the speed and quality of the move, abruptly coming from the slow, low tempo start, catches Coventry unawares, and Stoke take the lead.

So we can make our final conclusions about the major philosophies behind Stoke’s on-the-ball plan:

1 – When building from the back, use rapid changes from low to high-tempo play to bait the press.

2 – Play progressive passes with quality at high tempo through the pressing lines to exploit the space created by baiting the press.

3 – If necessary, or when building more quickly through longer passes, crowd 50/50 duels with combative players in order to win the second ball.

4 – Attack the space in front of the disorganised defence with large numbers.

5 – Work the ball wide, use dummy runners to drag the defence into the six yard box, and cut the ball back to late midfield runners near the penalty spot.

Of course, there are more specifics than this, and we saw in the second goal against Coventry that sometimes the plan is just to run fast and kick it long!

But, what I see here is evidence of Stoke targeting clear, data-backed tactical principles, and a few very specific moves that have led to fantastic results on the pitch.

The next few games will be a great benchmark for Stoke, facing teams who are far more likely to sit back in a low block and deny Stoke the chance to create those transitional moments.

It’s been something Stoke have struggled with all season, and despite improvements, they are still underperforming their xG. Given the number of games Stoke have lost while having a strongly positive xGD, we all want to see this issue dispelled in the next weeks.

But there is some really good evidence that Stoke may well have the most impressive side since relegation, possibly even since early 2016.

Thanks to any and all readers, and please feel free to comment and follow on Twitter at @potterlytics.

Should you wish to donate to help with the running costs of the site, and the data subscriptions we use, please feel free to visit our donations page here. Any and all help is very much appreciated!

George

Unleashed Tyrese? A Profile of Tyrese Campbell

So, Tyrese Campbell, eh? A divisive figure among many Stoke fans, so lets get the the bottom of it once and for all.

Is he actually any good? Well, long story short, yes.

But let’s look into the long story a little bit deeper. What is he good at? Where is he best used? Will he be my best friend? All this and more (maybe) answered below.

Who?

Let’s start off with an overall picture of the type of attacker Campbell is. Using the radar plot from our Player Stats Hub, we can build an insight into what style we’re looking for in the player.

From this, I draw three major conclusions.

Firstly, Campbell is an excellent creative force, in the top 10% of expected assists (xA – a measure of how likely a pass is to result in a goal) per 90, the top 10% for crosses per 90, alongside being in the top 25% for key passes (passes putting a player in a clear goalscoring situation), passes into the area, and deep completions (passes to the zone <20m from the opponent’s goal).

Secondly, he’s on an incredible finishing run, despite getting lower-value chances than almost 3/4 of forwards in the league, he scores above his xG by 0.07 per 90, in the top 25%. More on this later.

Finally, it’s clear he’s a very strong ball carrier, above 75th percentile in progressive runs (definition here), dribbles, dribble success rate, touches in the box, and offensive duels. Campbell is a strong forward who wins his duels and carries the ball incredibly well, taking on defenders and progressing play towards goal.

Surprisingly for many, he’s actually about average at winning aerial duels too. Take that, sarcastic cheer-ers.

He’s clearly a very well-rounded forward, but let’s dig a bit into each of these aspects, starting with his finishing.

The Boy’s On Fire

It’s actually incredibly rare for players to overperform their xG over long periods of time, so the stats above for Tyrese’s finishing are a little suspicious at first glance. Is he just on a hot streak? Well, weirdly, no.

Campbell has outperformed his xG in every season as a footballer besides his first 5 games at Stoke, played exclusively as a substitute in Paul Lambert’s doomed side.

Below we have a plot of Campbell’s cumulative goals and xG over his whole league career on the left, and a plot of his cumulative xG overperformance (i.e. his goals minus xG) over the same period of games. It’s clear he’s an oddly consistent performer.

Why though? If this is such an oddity, why is he such a consistent finisher? Well it could be that this is only a sample of just over 7000 minutes – just over 80 full games, but I think there’s some more to this that we can use to explain Campbell’s quality.

If You Have To Ask, You’re Streets Behind

One thing that shows up clearly in Campbell’s goalscoring is his preference for two zones either side of the D, just within the box.

Looking at his last 75 shots we can see a clear penchant for scoring from these two areas.

Image: WyScout

Due to this area obviously looking like a phone (right?), and definitely not due to me forcibly trying to hammer in the word ‘Ty’ to something, I’ve decided to coin this the ‘Ty-phone‘ zone. It sounds kind of like Typhoon too, which is a cool word. It’s verbal wildfire. I’m so sorry.

The ‘Ty-phone zone

Campbell’s quality turns these lower-value, lower-xG chances into goals at a disproportionate rate because of his specific skill in curling the ball to the far post.

We can delve into a few examples to see this in action.

First off, let’s look at his 2nd, and Stoke’s 3rd, away at Sunderland.

Click each image to zoom in.

Campbell gets the ball on the edge of the area to the left, drives at the back line, and attempts a shot.

It comes back on his right foot, and he curls it to the far corner through a crowd of defenders. This had 0.06 xG according to Infogol.

We saw a similar goal from the other side last season at home to Birmingham.

Click each image to zoom in.

Campbell takes it on the right outside the box and immediately drives at the defenders.

From there he cuts inside past a Birmingham defender and and whips it into the far corner.

Again, Infogol has this as a 0.06 xG chance for the average player.

Finally, we go back to the lockdown season vs. eventual promotion-winners Brentford.

Click each image to zoom in

Tyrese picks the ball up wide left. comes inside on his right foot, beating two defenders, and whips it again into the far corner.

Infogol has this chance at a tiny 0.04 xG.

So we have 3 very similar finishes here, and Campbell has done this on several more occasions, also adding his skill of driving the ball across the keeper, and powering it home at the near post as vs Peterborough in 2021.

But Hold Your Horses

Goals can be very deceiving, particularly when there are only 31 of them, so is there a different way we can quantify Campbell’s finishing skill? The answer, predictably, is ‘kind of but not entirely’.

Whereas normal expected goals (xG) refers to the probability of a player scoring a given chance at the point of a shot being taken, Post-Shot xG (PSxG), refers to the probability of a shot being scored after it has been taken.

This includes features such as the power of the shot, where it is headed in the goal, swerve and trajectory, and players unsighting the goalkeeper.

As such, one way to infer the quality of a player’s shooting is to compare the PSxG with the xG, to see how much a player’s shots improve the quality of chances they get.

Now, as a point of order, this is by no means a definitive measure of finishing quality. As with all statistics, this is just one, very imperfect measure by which we can gain some insight into what might be happening.

As an example, a shot near the top corner that just goes wide will receive 0 PSxG, whereas a slow dribbling scuff that goes straight into the keeper’s arms will receive a PSxG of above 0.

But, as an indicator, we can still use it to gain some insight, and as such we have the two plots below, showing Stoke players’ PSxG overperformance (i.e. the PSxG minus xG) vs the average quality of their chances (xG/shot).

Click each plot to zoom in

What we see here is another insight into Campbell’s quality of shot.

In the left hand plot, including all shots, we see that he’s added around 0.25xG to his chances.

In the right hand plot, we have discounted blocked shots, as these are typically ascribed a value of 0PSxG, whether struck into good areas or not.

In this case Campbell stands out alongside long-shot expert Lewis Baker. He has added over 1.1xG to his chances via his shooting skill this season, another indication that he has quality in striking the ball.

Tyrese, The Creator

Well, I think we’ve built up a solid idea of his finishing, so what about that glorious vat of creativity we saw in the radar? Well, let’s expand it a little and take a closer look.

Well, you’ll be glad to hear that Campbell is one of the most creative players in the league in his position.

Particularly impressive are the deep completions, xA and key passes, all signs of a quality creative player.

He progresses the ball exceptionally well, and the number of shot assists that are key passes is a good measure of this quality.

Let’s take a look at how Tyrese likes to get his assists, and I promise I won’t make up a new name thing for it this time.

Campbell is in the top 15% of crossers even compared with AM/Wingers, and carries the ball into the area more than 89% of forwards in the league (FBref).

He also attempts in the top 11% of take-ons among forwards, so we can tell that he likes to take players on, alongside getting lots of crosses in.

It’s also obvious from his heatmap below (for Campbell’s whole senior career) that he has a preference for running wide, with lots of touches wide of the box. Alongside that, we see those touches inside the corners of the box, in that Ty-Phone area again.

Image: Wyscout

We can see lots of this in action in his last assist, vs Swansea.

Tyrese gets the ball in a similar position to the goals explained above, where he scores in the Ty-phone.

Again, he drives at the defence, but this time he runs on the outside, beating a defender to cut the ball back to Laurent, who fires it into the top corner.

Click each image to zoom in

The same happened in the game against Huddersfield in January.

Campbell gets the ball on the edge of the box, again beats a defender and cuts it back into a dangerous area.

Brown gets two bites at it and then scores.

The cut-back from a take-on into wide areas is something Campbell is really bringing into his game this season.

Most importantly, many of these passes, cutbacks and crosses are not just high-volume, but also of a high-quality, leading to Campbell’s high expected assist numbers.

The skill Campbell has when attacking the box with the ball is rare at this level, and his output reflects that.

Spreading His Wings?

Now what about positioning? Campbell is a player who is often touted as ‘better from the wing’ by fans, and there’s no doubt that his skill-set in carrying the ball from deeper, and attacking the box from the half-spaces is fantastic.

That being said, does he have to play wide to play well? The answer is probably no.

Positions in modern football are a difficult concept to easily tie down. As a brief example, playing Gayle as a central striker and Brown as a central striker gives you two very different things. One will push higher on the back line and one will drop deeper.

What we do see is that no matter which ‘set position’ across the front line Campbell starts in, he still tends to get touches of the ball in deeper and wider positions, where he’s clearly dangerous.

We can see that in his heat maps below, each showing Campbell’s senior career touches when starting wide left, centrally, and wide right.

Click each image to zoom in

Simple ‘formations’ as we know them are not completely useless, but this is a good example where they are not fully describing the game in front of us.

As a central striker in Michael O’Neill’s 352, Campbell would still drop into many of the same positions he would occupy as a wide man in Alex Neil’s 433.

In terms of numbers, his output is still good in all positions too, although there is an increase when he starts wide, which I will explain further.

The table below shows his output per 90 minutes in each position in his league career so far.

Metric\PositionWide LeftCentralWide Right
Minutes91141802013
Goals0.490.340.45
Assists0.300.110.22
xG0.280.290.23
xA0.180.090.13
Dribbles/success rate %6.72 / 61.8%3.57 / 51.8%6.08 / 55.9%
Crosses/accuracy %5.73 / 29.3%1.79 / 25.3%3.00 / 34.3%
Passes to penalty area/accuracy %3.75 / 44.7%1.53 / 47.9%2.86 / 54.7%
Data: Wyscout

You may look at that and immediately conclude that Campbell is better playing wide, but remember many of these numbers will be due to the change in play style and not necessarily indicative of a player who is ‘better’ in one position than another.

As a striker, Campbell will be much more focused on running in behind and creating space for others, for example, which does not show up in his own numbers.

What we can say is that Campbell is great at dropping deep and driving at defences.

BUT….

As alluded to above, there’s another side to his play too. Let’s look at one of his goals from last season, away at QPR.

Click each image to zoom in

As Vrancic gets the ball, Tyrese immediately sprints forwards.

He breaks quickly through the dropping defence, into a huge open space to slot home from the edge of the box 1v1.

We saw a similar goal from Campbell against Preston this season too.

Click each image to zoom in

Baker receives the ball on the edge of Stoke’s box, and immediately plays it high and long for Campbell.

With a 10 yard deficit to make up, Campbell gets the ball before the Preston defender, cuts into his Ty-phone Zone and finishes in his trademark style.

So although Campbell’s skill running at defences & progressing the ball is clear, he’s also a huge threat in behind with his pace and particularly his 1vs1 finishing skill.

Conclusions?

So, what have we learned? Well, we’ve learned that I have some kind of obsession with Tyrese Campbell and/or numbers.

We’ve also learned that the numbers are very promising for his career, he’s a quality finisher of chances and has a skill level for progressing the ball that is rare among peers in this league.

He can play wide or central, but whichever you choose, you’d be silly not to try to get him involved in play as much as possible.

Thanks to any and all readers, and please feel free to comment and follow on Twitter at @potterlytics.

Should you wish to donate to help with the running costs of the site, and the data subscriptions we use, please feel free to visit our donations page here. Any and all help is very much appreciated!

George

What a Difference an O’ Makes – How Stoke Have Changed Under Alex Neil

It’s been just over 6 months since Alex Neil took over from his predecessor at Stoke City, and it’s tough to pretend there have been more ups than downs during his tenure.

As we approach the reverse fixture of that fateful day in August when Michael O’Neill sealed his fate, I can’t help but wonder just how have Stoke City changed.

With John Coates’ clear fandom of Alex Neil, having tried to make him the manager in 2019, there appears to be a lot of trust in Stoke’s new style, and despite not having his own team just yet, we’ve seen some big shifts so far.

Let’s take a look into some of the stats to see what insights we can gain.

Everything’s Coming Up Milhouse

First off, we can take a look at how Stoke’s expected goals (xG, explainer here) numbers have changed over the course of the shift from Michael O’Neill to Alex Neil.

For this, we’ll use a plot of 5 game rolling xG/game for and against.

Since the start of 21/22, Stoke have been inconsistent, which is a surprise to no-one.

Big shifts in both xG for and xG against show a the numbers expected of a mid-table side. Add onto this that Stoke have been below-average at finishing and well below average in goalkeeping, and you find a lower mid-table outfit.

But, since the World Cup, Stoke have been steadily improving defensively, to the point where they are expected to concede a goal only once every 150 minutes.

There’s also been significant improvement in creative output over the past few games, but this is a shorter trend, more likely to be as a result of playing against some poor sides in Blackpool, Huddersfield, and Swansea.

Nevertheless, Stoke’s current output, if they can produce it even over half of a full season, is that of a side at least challenging for the play-offs.

Unfortunately, Stoke’s xG numbers are pretty far away from their results, and we can look at this through the finishing statistics below. The plot shows the finishing quality of Stoke (their non-penalty goals minus their non-penalty xG per 90 minutes) against the average quality of their shots (xG per shot).

In both of the past 2 seasons, Stoke have been underperforming their expected goals by 0.1 xG per 90 minutes, which in 2022/23 is the 4th worst value in the league.

We also get a peek into one of Stoke’s style shifts this season, as their average shot quality has reduced from 0.11 xG to below 0.09 xG.

Interestingly, we can see that although the average shot quality is lower this season, Stoke have been taking about a shot and a half more per game, possibly another hint towards the change in playstyle. This plot shows the xG per shot, against the number of shots taken per 90 minutes.

Maybe there’s a clue about origin of these changes in the way Stoke have been shooting in their creative stats.

Each of the following plots is compared with the other teams in the Championship in that season. The length of each bar (and the colour) represents the percentile rank.

Click on each plot to zoom in.

The major takeaway jumping out here is that Stoke are one of the most crossing-oriented sides in the league this season.

Although Stoke crossed more than average last season, this season they’ve been putting more crosses into the area than all but one side, and they’ve also increased the number of set pieces that lead to shots too.

The expected assists values are also increased, indicating that Stoke’s creative players are putting the ball into better areas more often for others, but the low xG from assists value shows they’re not being converted to high-value chances.

Interestingly, and probably a little surprisingly, we see that Stoke were very potent last season at creating shots from defensive actions (e.g. tackles, interceptions, and blocks), creating 20 shots over the season from their total 925 shot creating actions.

Personally, I’m a little uncertain of FBref’s definitions here, as it only includes the action directly before a shot. This means that a player making an interception and then playing his teammate through on goal does not count as a shot from a defensive action, so I’m going to keep away from using this in too much depth.

But, for reference, an example of this is Lewis Baker’s late equaliser away at Barnsley.

As the ball bounces out to Quina, Chester rushes in and nicks the ball forward. Baker rushes onto it and thwacks a strike into the far top corner.

We’ve built a little bit more insight into Stoke as a team who like to work on set pieces and get the ball into the box, as opposed to the Stoke of last season who preferred to pass into the box.

Return of the build-up phase?

Let’s take a look at the build-up, where we will see a much clearer view of the changes that have taken place.

Click on each plot to zoom in.

First off, it’s incredibly clear that 2022/23 Stoke are much, much quicker at moving the ball forwards. In fact, they attempt more long passes than any other team in the league.

Contrasting this with 21/22, when Stoke completed 15 fewer long passes per game, and almost 50 more passes, alongside almost 40 more short passes per game, we see a side that has moved away from calm possession play and into transitional football.

We can further cement this by looking at the average pass progression, a measure of how much closer the average pass gets to the opposition’s goal. Stoke’s has increased from well below to well above average between the 2 seasons, indicating a willingness to get the ball forward further with each pass.

We see a similar story in the ratio of touches Stoke take in the attacking third compared with other areas of the pitch, deemed our ‘Attacking 3rd Touch Ratio’. This has increased significantly since last season, indicating that Stoke take a larger portion of their touches in the attacking third, and therefore that they get the ball forward quicker.

We can see this in the differences between Stoke’s attacking build-up vs Huddersfield under Michael O’Neill in August 2022, and vs Huddersfield under Alex Neil in February 2023.

First off, Huddersfield away under O’Neill:

Click each image to zoom in.

We see here that as Flint receives the ball, he plays a short pass off to Taylor. Taylor then puts it across the line to Wilmot.

All the while, Stoke have a clear shape of a back 3 with Flint deeper as an emergency passing option, Laurent dropping into the 6 position, and the wing backs pushed up wide offering options in space.

Stoke move the ball back across to Taylor and put it out to Sparrow, who plays it back when pressured. Laurent then receives the ball and turns, moving into space and getting the ball wide to Tymon.

This patient passing, waiting for an opening, was a major part of Stoke’s build-up under O’Neill. But what are the differences this season?

Moving onto Huddersfield at home under Neil:

Click each image to zoom in.

In this case, we see Jagielka returning the ball to the keeper, Šarkić, as he is pressed by Huddersfield players. Šarkić immediately shapes to punt the ball long, but instead opts to pass forward to Sterling.

Already we’re seeing a big shift from the calm passing of O’Neill, and in this instance Stoke’s defenders have split much wider to allow the ball to be progressed more quickly. The wingers and full backs are wider to allow progression down the channels, and the midfield are more tightly bunched together to prevent a counter through the now-open centre of the pitch.

Sterling turns, takes on a challenge from a Huddersfield wide player, and plays it forwards again to Brown, who runs from the halfway line to the edge of the Huddersfield box. He plays a ball in to Gayle who miscontrols.

We see here the difference, Stoke shape up much more open under Neil in order to progress the ball quicker, and Šarkić is used as the spare man for possession, ready to play it forward quickly if needed.

The passes between defenders are far less frequent, and the ball moves forward very quickly.

That said, we have seen in recent matches a return of the build-up phase to Stoke’s play, and particularly vs Blackpool the centre backs would draw the press before playing incisive forward passes.

But we don’t always have the ball, and our work off it is just as interesting as on it. Or at the very least, if you’ve read this far then you may as well keep going.

Dr. Midblock or: How I Learned to Stop Worrying and Love the High Press

We turn again to our trusty radar plot to check how Stoke’s defensive work has evolved with the change in manager.

Click on each plot to zoom in.

A couple of big shifts here, but we can note that Stoke are actually a side who tackles efficiently but fairly rarely when adjusted for possession, across both seasons.

However, most interesting to me is the jump in what I have called the Tackle Depth Index. This measures the average 3rd in which tackles take place, and for Stoke this has jumped from about average to well above average since Neil’s appointment.

This indicates a team doing its defensive work much higher up the pitch, and the increase in both middle and attacking 3rd tackles, alongside a decrease in defensive 3rd tackles, further implies that Stoke are pushing their defensive line further toward the opponent’s goal.

When combined with this data, the increase in the number of blocks indicates a side that will put more bodies closer to opponents as they move towards Stoke’s goal, and we see that reflected in the PPDA numbers too, as below.

PPDA, or Passes allowed Per Defensive Action, refers to the number of passes a team allows the opponent to make before attempting a defensive action, such as a tackle, interception, or block.

This is a metric that gives an indication of the pressing intensity of the side. Although like all stats, it’s not perfect, it does provide useful insights.

Remember, a lower PPDA number indicates a team presses with more intensity, as they allow fewer passes before making a defensive action.

We can see that Stoke have managed to increase their pressing intensity, whilst at the same time slightly improve their defence.

This pressing has been really visible in recent games against Swansea and Brighton, where Stoke have been very efficient at setting traps for the opposition to play the ball into.

Looking at the Brighton game, Stoke are playing a far superior side who are incredibly adept at drawing a press and finding space to play through, but they more than held their own for large portions, forcing Brighton to play longer passes into their strikers or lose the ball in midfield.

We can see from the Wyscout data below that Stoke completed a lot of duels (and won more than 50% of them) in the opposition half and defensive third.

Duels vs Brighton Image: Wyscout

We can also see from the ground duels blow that Stoke competed for the ball a significant amount in Brighton’s half.

Ground Duels vs Brighton. Image: Wyscout

Stoke allowed Brighton to play out through the centre halves, and then set traps that took advantage of their athleticism to win the ball back when Brighton tried to progress through the lines. It was incredibly brave and something that had worked very well in the previous away fixture at Swansea.

Unfortunately, Wyscout don’t have access to the Brighton footage, but we can show the same process in action against Swansea below.

Click each image to zoom in.

As the ball is played back to Swansea’s keeper, Gayle starts to press. Brown and Campbell guard an area behind the wider centre backs, and Smallbone drops with the Swansea midfielder looking to find space.

As the ball moves out to the left centre back, Brown engages.

This, along with the close marking of passing lanes and players from Smallbone, Gayle, and Campbell, forces the Swansea player to go long.

As he goes long, Pearson is marking the wing back, and regains the ball.

As he does so, we see that Wilmot and Laurent were also closely marking players in the midfield, meaning any longer pass from Swansea would likely result in a duel in Stoke’s favour.

This mechanism of not necessarily tackling the opposition 1 v 1 immediately, but forcing them into an area and enticing them to play the ball in ways you want them to is crucial to a functioning pressing side.

Note here too how Tyrese Campbell is a core part of this press, which hopefully puts to bed the unfounded criticism he’s received for not working hard. You don’t have a press this efficient with a lazy player.

This combines to give us a summary of how much we’ve seen Stoke change since O’Neill left just over 6 months ago.

Conclusions

So, what can we gain from all this? What was the point of the last 2200 words?

Well, there was no point to it really, it’s just for fun, just a roflcopter landing on the helipad of life, as Barry Homeowner might say.

But, we can definitely gain insight into what Alex Neil has changed at Stoke.

We see a side that has ditched the slow patience of Michael O’Neill’s 352 low-tempo possession build-up in favour of moving the ball forward much more quickly.

We see a team much preferring to play in transition, and building up in such a way as to force those transitions from the opposition.

We also see a team much higher in their press, and much more crossing-heavy.

All this change despite Alex Neil not having his own players just yet, and despite many injuries dictating squad decisions. It’ll be very interesting to see what happens in the summer should Stoke survive.

Thanks to any and all readers, and please feel free to comment and follow on Twitter at @potterlytics.

Should you wish to donate to help with the running costs of the site, and the data subscriptions we use, please feel free to visit our donations page here. Any and all help is very much appreciated!

George

xG – A Stoke City Explainer!

You see it everywhere in football nowadays, it’s even grown to the point where Sky Sports show it on their post-match stats.

We now appear to be at a point where not only is eXpected Goals (xG) assumed to be common knowledge, it’s also something that its assumed everyone fully understands. But for a lot of people, xG is just a term that suddenly appeared and isn’t necessarily well-understood.

Considering this, I thought a good way to start off the blog here at Potterlytics would be to go through a little xPlainer (I’m sorry) of expected goals, told through the lens of Tyrese Campbell and two beautiful Stoke City goals from recent seasons.

The Basics

So let’s start by looking at the basic concept behind xG.

Football is a very low scoring game, with a high proportion of randomness to the results. It’s much easier for a lower-quality team to eek out a win through a bit of luck in football than in, say, basketball, where games finish with much higher scores.

This means that in football, the final score is generally a poor metric by which to measure the quality of a team’s performance, or to understand the major themes within a match.

As an example, you could say ‘well Stoke had 14 shots and Preston only had 3’ to show that Stoke were the better side, but on further inspection it could be the case that Stoke tried 14 Charlie Adam-esque shots from the halfway line in the last 10 minutes, and Preston had 3 shots from 5 yards out. This is the point where we’d say ‘they had the better chances’.

The best way to consider xG is that it gives you a number that quantifies just how good a chance is. Taking into account historical data, namely thousands of shots from previous seasons, an xG model tells you just how often the average player can be expected to score from a given chance.

There is no such thing as a perfect metric for the quality of a performance, but xG helps at least compare the quality of chances created.

#Ambition’: An xG map of Stoke’s 1-0 win over Arsenal in August 2017, thanks to a Jese goal assisted by Berahino. Larger squares indicate a higher xG chance, and a higher probability of scoring. The pink square is the goal. Credit: Michael Caley, @MC_of_A

‘How can you score 0.47 goals? What a load of ****’

xG values are usually quoted in terms of the probability of a goal being scored from zero to one. 0 xG would indicate that it’s impossible to score the chance, and 1 xG would indicate that it’s impossible to miss.

If a chance has an xG of 0.47 from a given model, that means that in that model’s historical data, a goal was scored from this type of chance 47% of the time, i.e. for every 100 of these chances, there were 47 goals.

Interestingly, it’s usually the case that xG is much lower than you’d expect, for lots of chances. xG can never be 1, as even a half-yard tap in is missed very occasionally. Let’s give a few examples and then take a look at a very fun Stoke City goal.

‘How’s he missed that?’

Take, for example, a penalty. Before you read on, think carefully and have a guess at how often you’d expect an average penalty taker to score. 90% of the time? Surprisingly it’s not that high! A penalty is in fact (using Wyscout models) 0.76xG, meaning only 76% of penalties are scored.

Extra points if you assumed lower than 0.76 because of Stoke’s record.

We can take a look below at the xG model that takes into account only the location of the shot, to see what kind of values we can expect:

An xG map showing the probability of scoring from various locations on the pitch. This model takes into account only the location of the chance. Credit: https://www.datofutbol.cl/xg-model/

Now better models will take into account much more than just the location of the shot. Let’s use Tyrese Campbell’s goal vs Preston, from 22/23, as an example:

Unleash Tyrese

In the 2-0 away win at Preston North End, Tyrese Campbell scored the second goal with a placed shot from just inside the box. On our map above, the location is marked with an ‘x’. We see that this gives us an xG value of around 0.15, meaning a shot from this location is scored about 15% of the time according to the model.

If we look at Infogol’s model value, we see that they assign a probability of 0.12 xG to this chance.

Wyscout on the other hand, assign it a value of 0.07 xG, and FBref.com go even lower to 0.03 xG.

Where’s that difference coming from?

Well, aside from models using different datasets, which will include slightly different shots, and models themselves learning from the data differently, the major difference here is what information is included when we define a type of shot.

‘This man’s magic’ – Campbell has very little space and a lot to do to score this chance. Image from Wyscout

Looking at our first model from the map above, we see that in Campbell’s shot, he’s about 14 yards out, to the right of the goal, and that’s all the information our model has! From this, we can say only that a shot from this area results in a goal about 15% of the time.

Now, better and more rounded models can add in more info. For example, the 3 other models take into account information such as angle to the goal, how the shot was assisted (e.g. cross or through ball), and the body part with which it was taken (strong/weak foot or header).

In addition to this, many of the models will include even more infortmation. Opta data (used by FBref.com, and many professional football teams/leagues) takes into account the positioning of defenders, the status of the goalkeeper (is he set or in motion?), and the height at which the shot is struck.

We can see very simply how this affects the xG value. Our FBref value of 0.03 xG was much lower than the others, due to the pressure Campbell is under. Two defenders directly in front of him, and a set goalkeeper waiting for the shot.

Left: A 0.15xG chance, Right: A 0.03xG chance

The Return of the Messiah

Now we can further see this difference by comparing the Preston goal with Campbell’s first goal after his injury layoff, vs Peterborough in November 2021. He receives the ball from a pass by a teammate, and takes a shot from a similar position.

Similar position, same outcome. Campbell finishes well on his weaker foot past the keeper.
xG = 0.25. Image: Wyscout

However, this time, there are two obvious differences.

Firstly, Campbell takes the shot with his weak foot, slightly decreasing the chance of scoring. More importantly, however, he has a clear view to goal, with only some pressure to his left, from a defender he has just dribbled past.

The combination of these extra differences for two chances in a similar position increases the FBref xG from 0.03 xG to 0.25 xG.

Hopefully this provides a nice intro and explainer for those who are interested in Stoke, and didn’t previously understand what xG was used for and how it was developed. Any and all comments are appreciated!

This is the first of many posts on this blog, and the aim is to contribute between once a fortnight and once a week some form of longer piece here. Alongside that, we have regular brief threads on Twitter at @potterlytics.

Should you wish to donate to help with the running costs of the site, and the data subscriptions we use, please feel free to visit our donations page here. Any and all help is very much appreciated!

George