

It’s been said all season, and part of last season too: why do Stoke always lose when they have more possession?
Pete Smith of the Sentinel (@PeteSmith1983) posted just after the Millwall loss, that Stoke ‘have picked up 1 point from the 11 games when they’ve had most of the ball.’
Well, Pete, I’m afraid I have some even more horrifying stats about this to clog up the internet.
Of the top 13 highest possession games Stoke City have had this season, they’ve lost 12 and drawn 1.
Of the 18 games where Stoke have had more possession than their opponents, they’ve won just 2 and drawn 2.
But why is this the case? Are we rubbish at keeping the ball? Are we doing too much of that ‘tippy tappy sh***’? Should we be back to a Mike Bassett 4-4-f*****-2?
Well, let’s take a look into how useful, or not, possession stats can be.
‘Get it forward, boooooooooooo’
First off, let’s look a bit more in depth at those Stoke stats. We might be losing more games, but what does the xG (expected goals) say?
xG can provide a better reflection of a game, by taking into account the quality of chances a team created. For more info see our xG – A Stoke City Explainer! article.
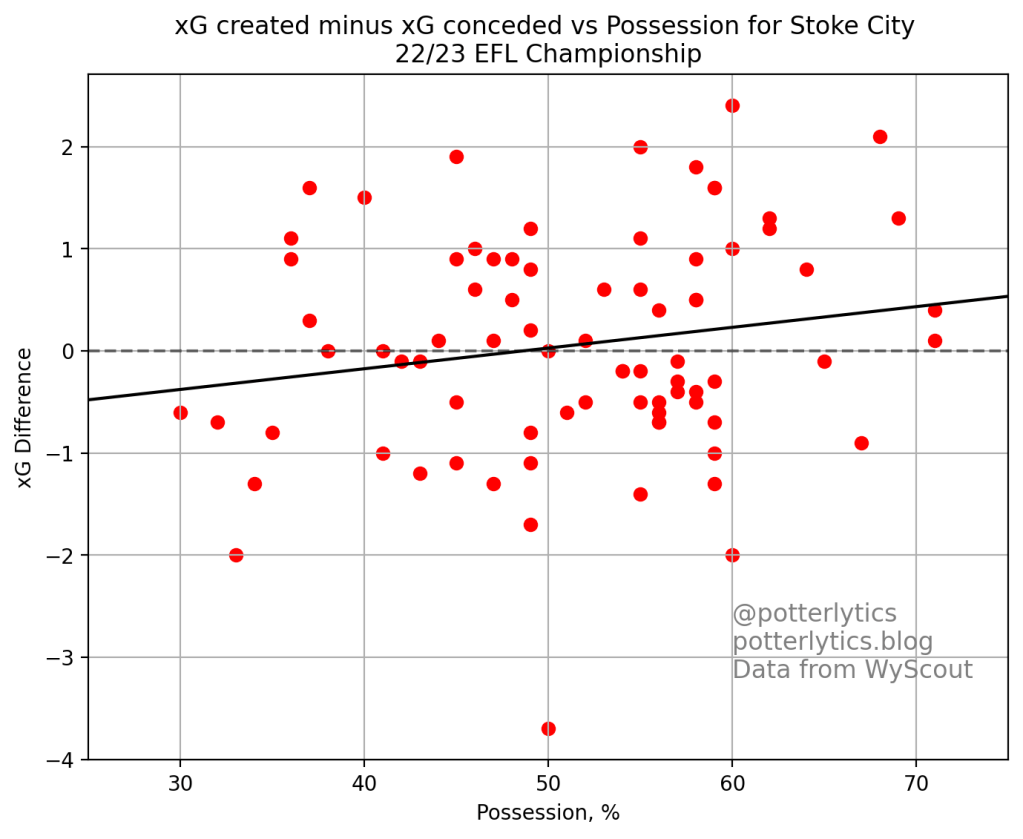
We see that there’s a weak correlation between xG difference and possession, but definitely not enough to draw sweeping conclusions from.
All we can say is that Stoke’s possession doesn’t seem to have much effect on the difference between chances created and conceded, but when they have more possession there is a slight tendency to create more than the opposition.
Now this makes sense, the more of the ball you have, the more chances you’ll create, but we are also seeing signs of what will become a major conclusion from this article.
In the Championship, most matches are not whitewashes one way or another. While there are better and worse sides, many games are decided by a few moments in a closely-fought slog over the 90 minutes.
Because of this, it’s rare to get sides who dominate the ball throughout the whole 90 minutes, and it’s rare to get sides who consistently create through the whole 90 minutes too.
This means that possession can be highly based on Game State.
Game State
Game state refers to, as you’d expect, the current state of the game. This includes information such as who is winning/losing/drawing, by what score, how long is left, and do both teams have 11 men on the field, among other things.
When the game state is negative for a team, i.e. they are losing, they tend to increase their share of possession as the other team becomes less aggressive and plays with lower risk. The opposite is also true of the winning side, as they drop deeper and sit off, they tend to decrease their share of the possession.
With this in mind, one thing we can look at is how Stoke’s possession varies on a game-by-game basis, depending on if they’re winning, losing, or drawing.
For ease of reading this graph, I’ve combined losing and drawing game states into one.
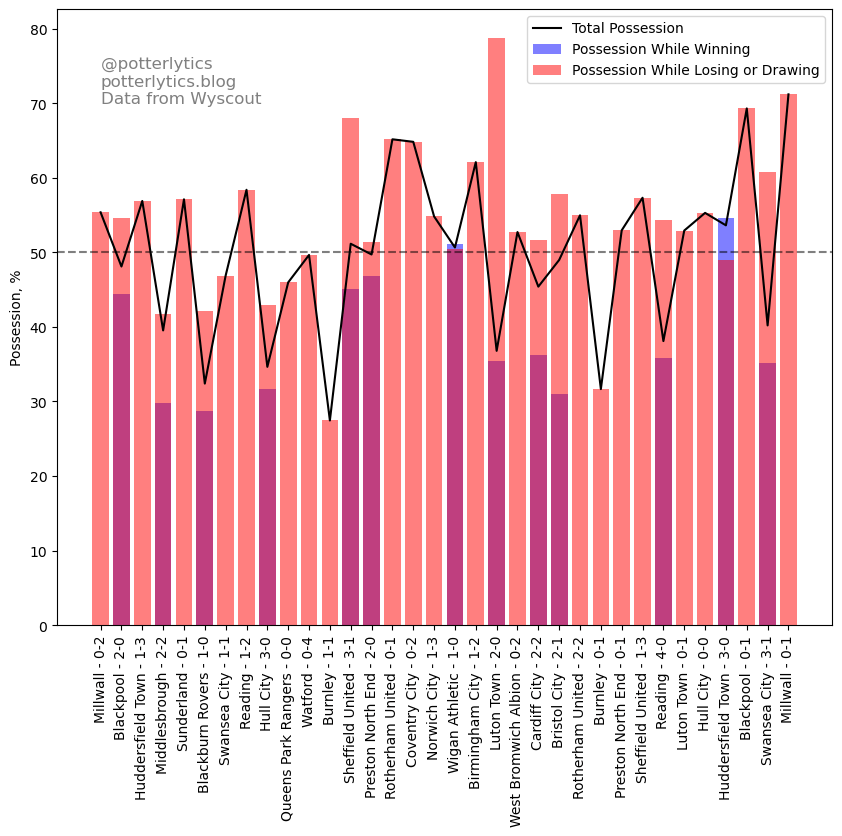
On the x axis we have this season’s games, and on the y axis we have possession figures.
The black line denotes Stoke’s overall possession in that game, across the full 90 minutes.
We see that for all but 2 of the games in which Stoke have had over 50% possession, they’ve had more than half of the possession whilst losing or drawing, and less than half of the possession whilst winning.
When Stoke are winning, they ease off the possession and sit behind the ball, when losing, the opposition tend to do the same, allowing Stoke much more of the ball.
We notice that on the 2 occasions where possession whilst winning is greater than overall possession come against Huddersfield at home – a game where Stoke were by far the dominant side, and Wigan away – a scrappy affair against a poor Wigan team, where neither side could command the ball well or really dominate play.
To look at a slightly easier-to-interpret plot, here is the same x axis of matches, but looking instead at the difference between overall possession and possession in a given game state. Again, drawing and losing have been combined for ease.

Now we can see more easily, the blue bars – when Stoke are winning – are almost all below zero, meaning Stoke have less possession when winning in these games.
The red bars – when the game is even or Stoke are behind – are almost all above zero, meaning Stoke have more possession when not in the lead.
There are, of course, many more factors involved in this. For example, Stoke scored very early on vs Luton at home, meaning the huge possession increase ‘when drawing and losing’ is largely impacted by the opening 3 minutes of the game before Powell scored.
Now it is especially true that Stoke are underperforming their xG by a significant amount, and when in losing situations Stoke have scored 5.51 goals below their expected value.
For winning situations they are overperforming by 0.32xG, in drawing situations they are underperforming by 2.19xG, and the plot below shows these xG performances on a per 90 minute basis. A negative value means scoring less than expected from the chances a team has had, and a positive value means scoring above expected from the chances.

This poor finishing makes a huge difference to the final results, and is certainly a contributing factor to apparent possession – result relationship. Stoke’s results when losing are much worse than their performances in terms of chances created, and as such there are more losses than there necessarily should be.
What we can gain from this is that for sides who aren’t dominant in their leagues or don’t play a specific style of possession based football, such as Manchester City or Swansea, possession does not dictate results.
In the case of Stoke, the relationship appears not to be that more possession causes worse outcomes, but that the game state is dictating the amount of possession.
The poor outcomes then come as a result of Stoke’s awful run of finishing when behind in games, and their inability to win when conceding first during games.
Should we be frustrated that Stoke lose a lot of games when they have more possession? Yes.
Do Stoke need to focus on playing with less possession because it appears to give better results? No.
We once again find ourselves in a situation where correlation does not necessarily mean causation, and in fact the causation is arguably the opposite way round!
Thanks to any and all readers, and please feel free to comment and follow on Twitter at @potterlytics.
Should you wish to donate to help with the running costs of the site, and the data subscriptions we use, please feel free to visit our donations page here. Any and all help is very much appreciated!
George
